Can State-of-the-Art LLMs Detect Table Spans in Spreadsheets? Exploring the Impact of Sheet Representation Strategies


Spreadsheets are indispensable in data-centric workflows, often housing complex structures like tables. Despite their structured appearance, spreadsheets present significant challenges for automated systems:
- Semi-structured content in spreadsheets, which we refer to as Tables in the rest of this blog post, often lack explicit boundaries, making it difficult to identify their start and end coordinates.
- Multiple tables may coexist in a spreadsheet interspersed with metadata, notes, or unrelated content.
Figure 1 below illustrates the problem of table span detection, showing how multiple tables within a spreadsheet can have distinct spans that need to be identified:
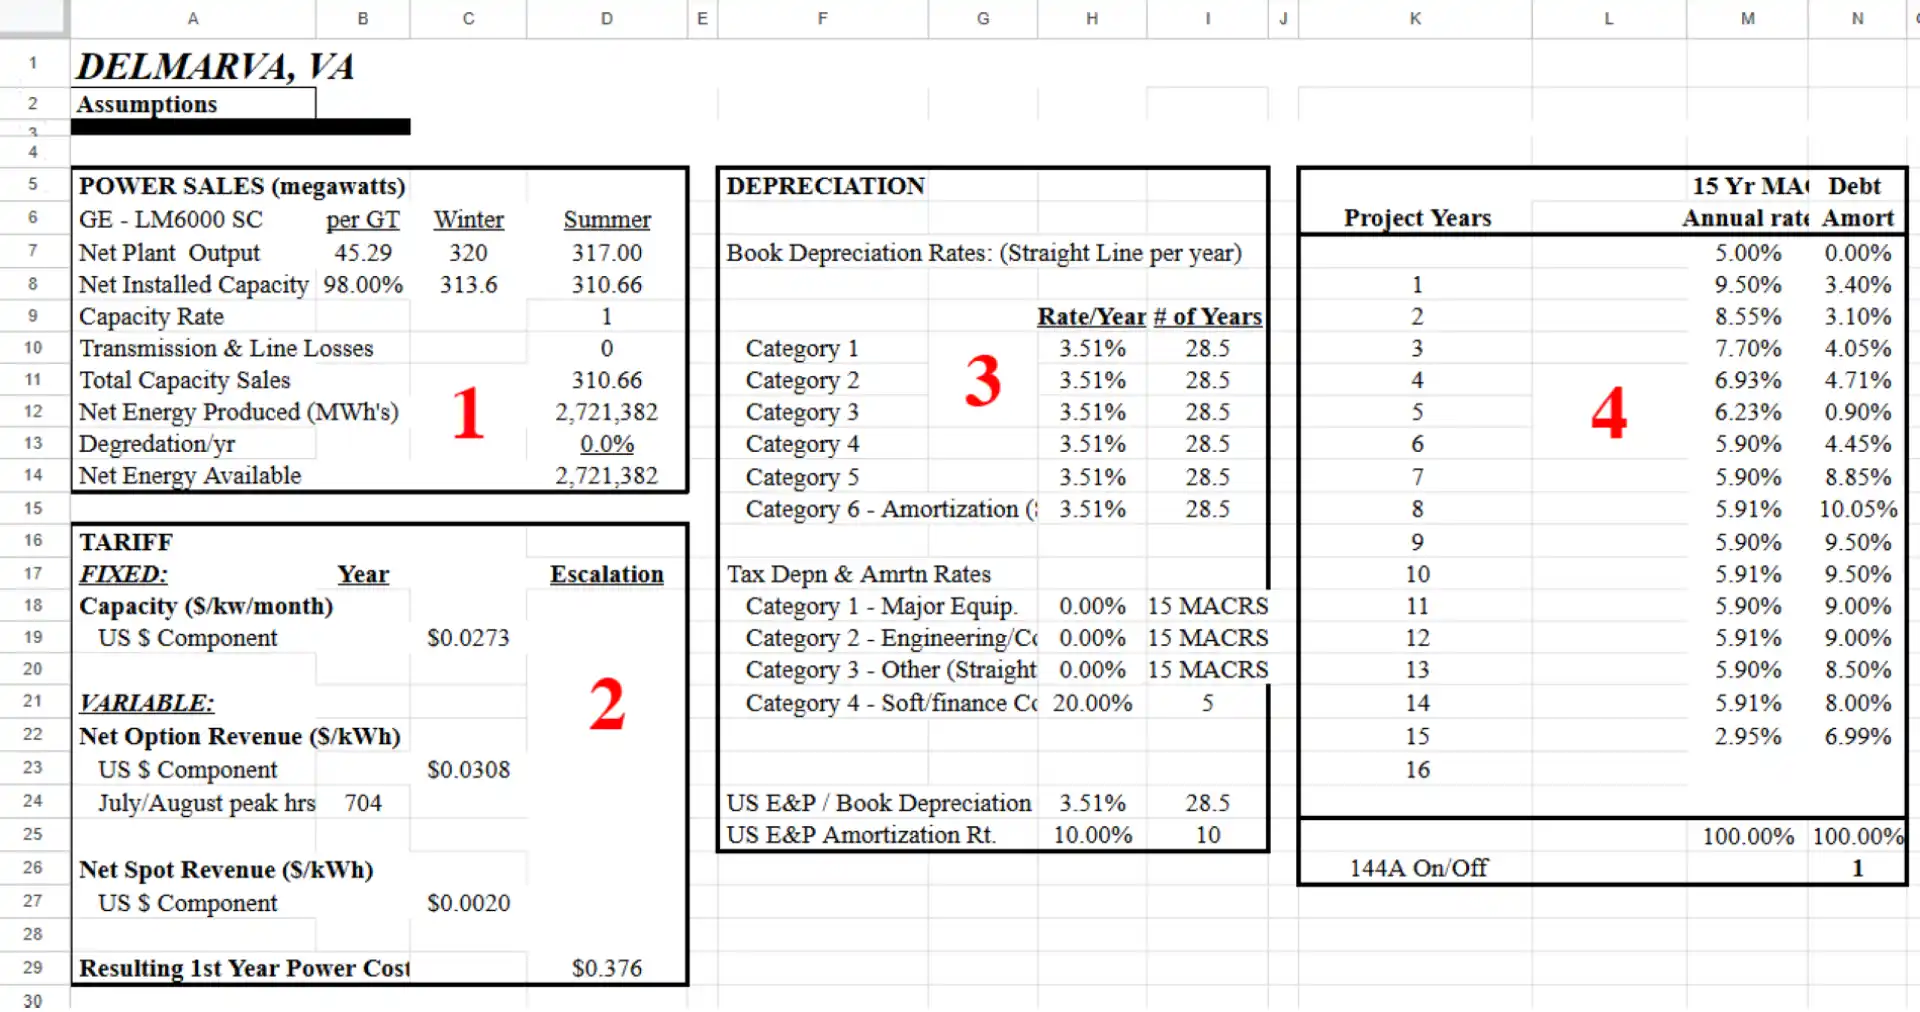
Figure 1: Example of table span detection- identifying the start and end boundaries of tables (e.g., Table 1: A5 to D14, Table 3: F5 to I25, etc.) in a spreadsheet. (ref: SpreadsheetLLM)
Research efforts such as TableSense and SpreadsheetLLM (Microsoft) have demonstrated the significance of table span detection in downstream tasks like data extraction, automation, and analytics.
- TableSense combines visual and structural features to achieve high precision in table span detection, ensuring accurate data extraction and interpretation.
- SpreadsheetLLM extends this idea by fine-tuning large language models (LLMs) for end-to-end spreadsheet understanding, covering table span detection, header recognition, and more.
However, these approaches rely on model fine-tuning, which requires substantial computational resources, making them less accessible to organizations without dedicated AI infrastructure.
This blog explores an alternative: leveraging general-purpose state-of-the-art LLMs (such as Claude and Gemini) to detect table spans without the need for fine-tuning. Our study centers on designing effective representations of spreadsheet data to maximize these models’ understanding and capabilities.
Simplifying Table Span Detection with State-of-the-Art LLMs
Our objective is threefold:
- To evaluate how different spreadsheet representations—structured, visual, or minimalistic—impact an LLM’s ability to detect tables accurately.
- To analyze whether table span detection remains challenging for state-of-the-art models like Claude and Gemini, even when optimized spreadsheet representations are utilized.
- To determine which representation offers the best balance between accuracy and cost, ensuring practical alignment with business needs.
Why Explore Different Formats?
The representation of spreadsheet data plays a key role in how well LLMs interpret structure and detect table boundaries.
Each format presents unique advantages:
- PDFs present a visual format that may enhance a multimodal model’s ability to interpret complex layouts.
- HTML provides structured data, allowing models to understand layout relationships and content hierarchy.
- Markdown offers a simplified format, assessing whether a minimalistic format is sufficient for accurate table span detection.
Proposed Approaches
We aim to determine which format delivers the best performance in table span detection when utilizing API-based LLMs. To achieve this, we evaluated four distinct approaches of representing spreadsheet data for table span detection:
HTML Representation with Color Encoding
We converted the spreadsheet into an HTML format, where:
- White cells represent non-empty cells containing data.
- Black cells represent empty cells. This approach uses color coding to provide visual cues for table boundaries.
Plain HTML (No Color Encoding)
In this variation, we retained the HTML structure but removed color information, representing cells based purely on their content and structure.Markdown Representation
The HTML from Approach 2 was converted into the Markdown format, which offers a simpler, text-based representation of the spreadsheet structure.Visual PDF Representation
The color-encoded HTML from Approach 1 was converted into a PDF format with the help of multimodal LLMs. The color codes here enhanced the visual representation of cell boundaries.
Note: Inspired by Microsoft’s SpreadsheetLLM paper, in all four approaches, we included cell IDs (e.g., A1, B22) for each cell, providing a consistent reference for positioning. This ensured that LLMs could effectively associate content with its spatial context.
The figures below illustrate the different representations used in our experiment:
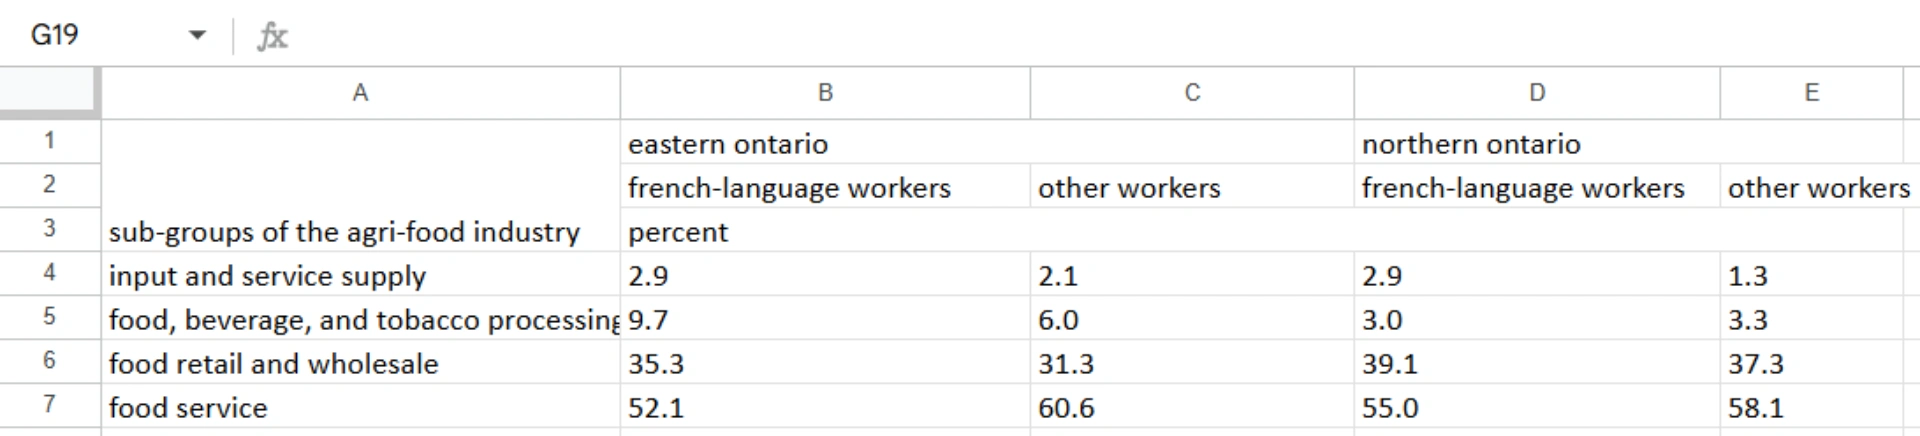
Figure 1: Input Spreadsheet
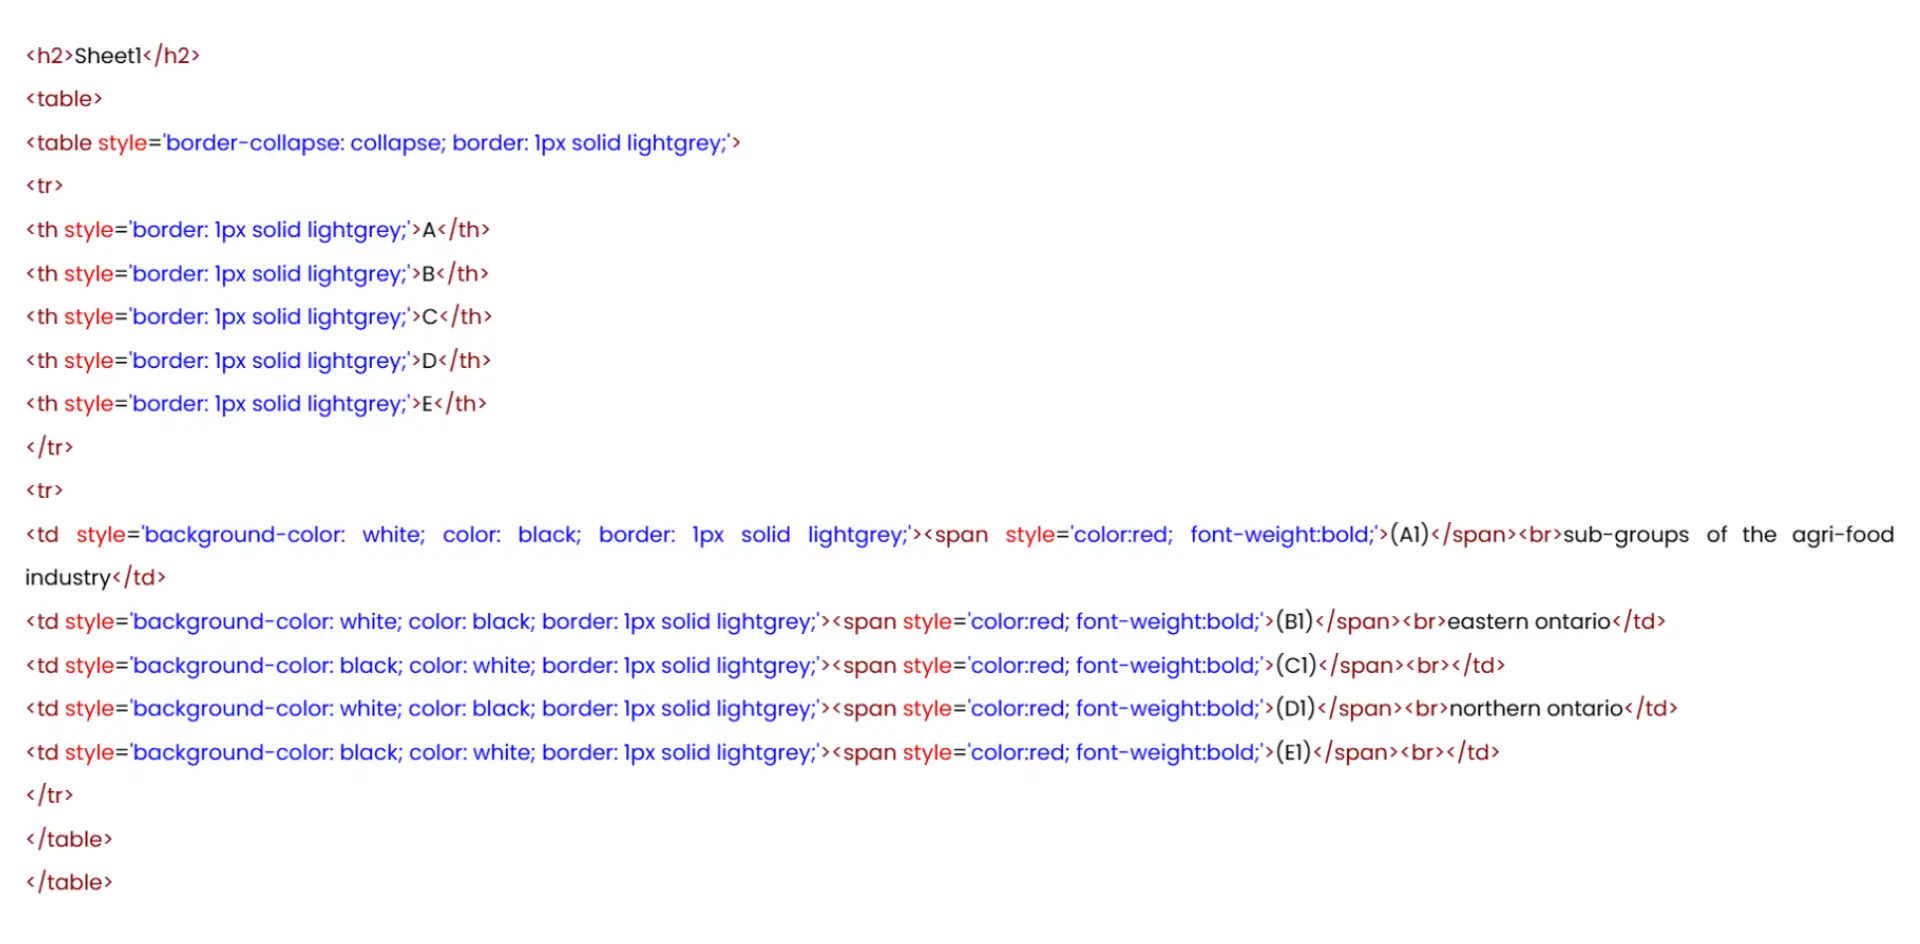
Figure 2: HTML With Color Encoding
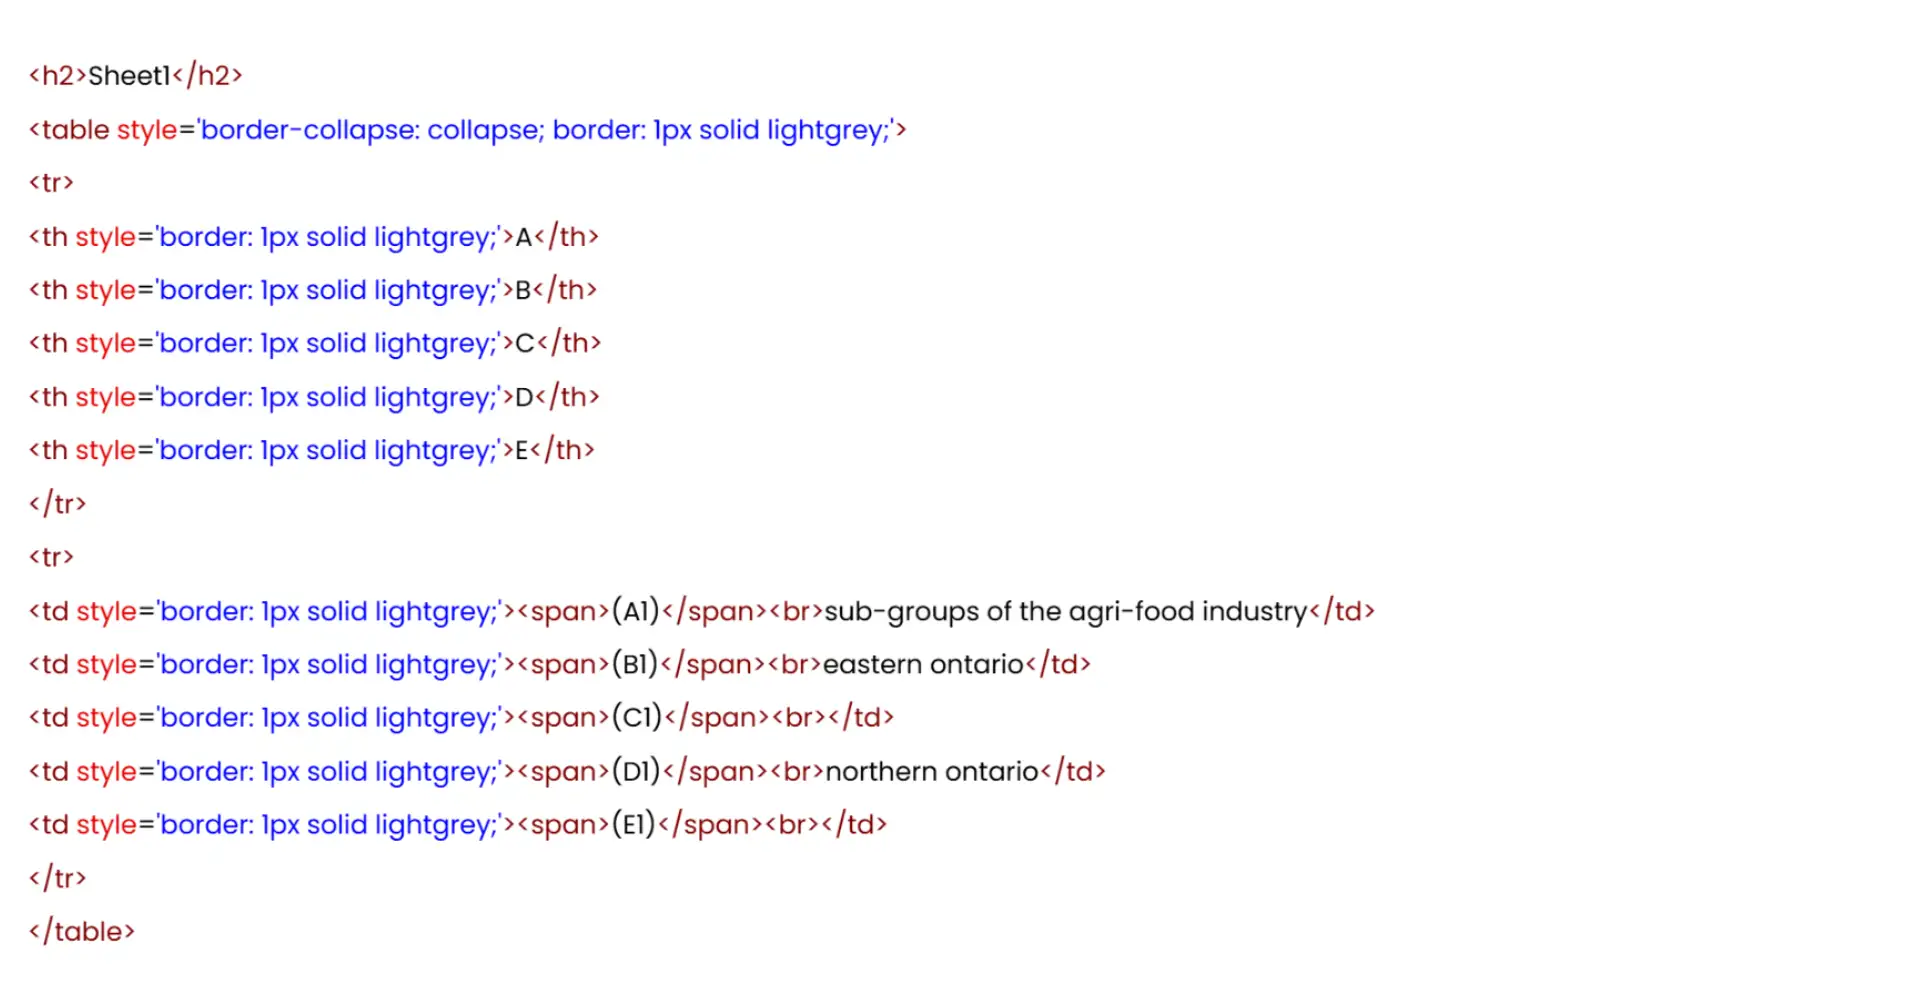
Figure 3: Plain HTML

Figure 4: Markdown Representation
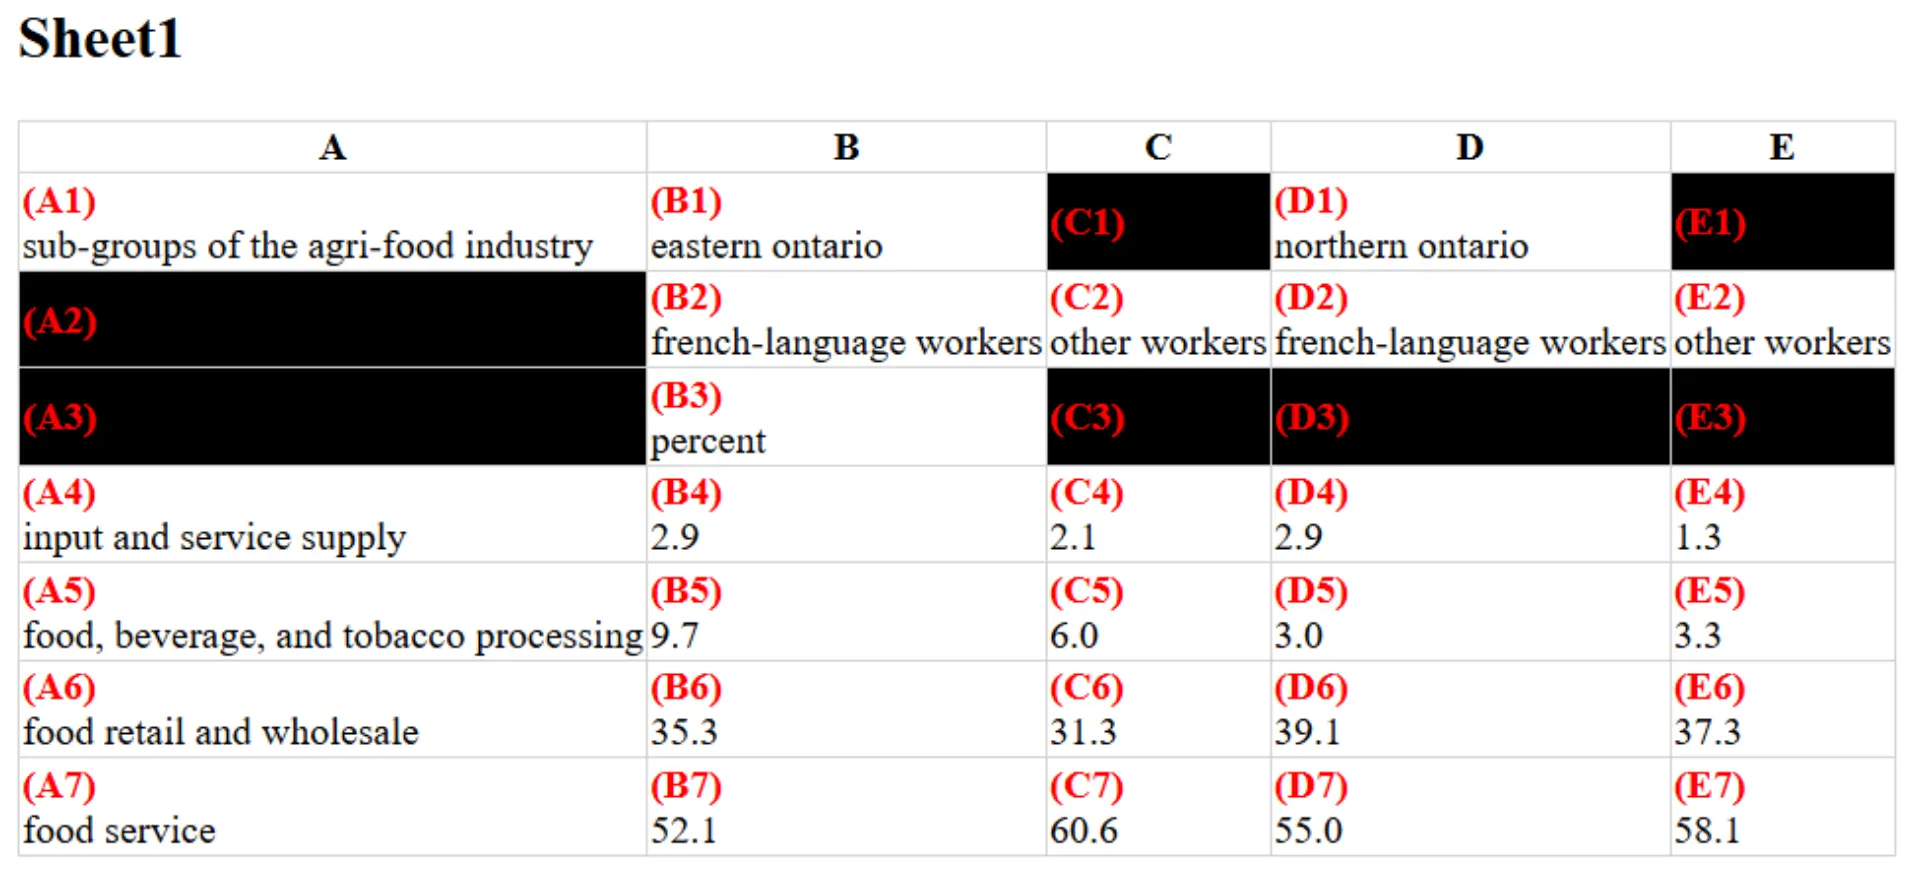
Figure 5: Visual PDF Representation
Dataset
For our evaluation, we utilized the DECO Dataset (A Dataset of Annotated Spreadsheets for Layout and Table Recognition), a widely recognized benchmark for spreadsheet analysis, containing pre-annotated spreadsheets with detailed table span information, making it an ideal choice for evaluating the table span detection capabilities of state-of-the-art LLMs. From DECO, we curated two subsets based on the number of tables in each spreadsheet:
Single-Table Spreadsheets
- Sample Size: 50 spreadsheets
- Description: Spreadsheets containing exactly one table were chosen to evaluate LLMs’ ability to detect unambiguous table spans.
Multi-Table Spreadsheets
Sample Size: 67 spreadsheets
- 50 spreadsheets containing two tables per sheet
- 17 spreadsheets containing three tables per sheet
- Description: Spreadsheets with multiple tables on the same sheet were chosen to test LLMs’ ability to distinguish overlapping or adjacent table spans.
Evaluation Metric
To assess the performance of state-of-the-art LLMs in detecting table spans, we adopted the Error-of-Boundary (EoB) metric as defined in the TableSense paper. This metric measures how accurately the detected table boundaries align with the ground truth bounding box, providing a clear indication of the model’s precision in identifying table spans.
Interpretation & Connection of EoB to Precision, Recall, and F1
While EoB gives an intuitive measure of boundary accuracy, our final results are reported using standard metrics— precision, recall, and F1 score. To make this connection:
- EoB = 0: The detected bounding box exactly matches the ground truth, indicating perfect table span detection.
- Predictions with EoB ≤ 2 are treated as true positives (TP), indicating a successful detection, as the boundaries deviate minimally (≤ 2-row/column deviation) from the ground truth.
- Predictions with EoB > 2 are false positives (FP), indicating significant deviation and a failure to detect the table correctly.
- Ground truth tables missed by any prediction are false negatives (FN)
For our evaluation (precision, recall, and F1 Score), we focused on EoB ≤ 2 as the threshold for successful detection. This choice aligns with the practical requirement that minor deviations are acceptable for real-world applications, where precise detection within a two-row or two-column margin suffices for most downstream tasks.
Single-Table Spreadsheets: Results, Key Findings, and Takeaways
The table below summarizes the results for the four input context modes. The input tokens, output tokens, and cost reported are the total values aggregated across the entire evaluation dataset (50 samples).
| Input context mode | Model | Precision | Recall | Input Tokens | Output Tokens | cost ($) |
| claude-3-5-sonnet@20240620 | 0.62 | 0.62 | 166731 | 20152 | 0.8027 | |
| gemini-1.5-pro-002 | 0.42 | 0.42 | 93900 | 37291 | 0.30383 | |
| HTML with Color Encoding | claude-3-5-sonnet@20240620 | 0.88 | 0.9 | 655385 | 33909 | 2.47 |
| gemini-1.5-pro-002 | 0.8235 | 0.84 | 612430 | 35486 | 0.942 | |
| Plain HTML | claude-3-5-sonnet@20240620 | 0.843 | 0.86 | 413929 | 30856 | 1.704 |
| gemini-1.5-pro-002 | 0.862 | 0.88 | 381610 | 35856 | 0.6562 | |
| Markdown | claude-3-5-sonnet@20240620 | 0.8461 | 0.88 | 184753 | 34914 | 1.0781 |
| gemini-1.5-pro-002 | 0.792452 | 0.84 | 193938 | 36181 | 0.33281 |
Key Findings:
Representation Matters
- HTML-based representations are superior.
- PDFs perform poorly.
Avoid PDF for Table Span Detection
- While PDFs are common input in real-world workflows, they fail to capture the structural context required for precise table detection.
- Both models, Claude (precision: 0.62, recall: 0.62) and Gemini (precision: 0.42, recall: 0.42), performed poorly on PDF inputs.
Cost-Effective Strategy
- HTML with Color Encoding → best results, highest cost
- Plain HTML → middle ground, competitive performance & cost
- If API costs are a concern, Markdown is the most affordable option for Gemini, costing only $0.33281 while maintaining reasonable performance.
State-of-the-art LLMs Still Face Challenges
- Detecting table spans in spreadsheets remains challenging, especially when dealing with merged cells or metadata near table boundaries. Multi-table spreadsheets may require more sophisticated contextual analysis or fine-tuning.
Multi-Table Spreadsheets: Extending the Experiment
After evaluating single-table spreadsheets, we extended our analysis to the more challenging task of multi-table spreadsheets. This scenario requires models to identify and distinguish multiple tables within the same spreadsheet.
Why Only Two Representations?
From the single-table analysis, we observed that PDF performed the worst, and Plain HTML achieved the best cost-performance balance. Hence, we focused on these two representations to explore how LLMs perform in multi-table scenarios.
| Model | Input context mode | Precision | Recall | Input Tokens | Output Tokens | cost ($) |
| claude-3-5-sonnet@20240620 | 0.1527 | 0.1527 | 492492 | 57530 | 2.340426 | |
| Plain HTML | 0.439 | 0.433 | 1634833 | 94696 | 6.92 | |
| gemini-1.5-pro-002 | 0.0434782 | 0.0434782 | 182821 | 88110 | 0.669 | |
| Plain HTML | 0.4266 | 0.41558 | 1634833 | 92005 | 2.5 |
Key Findings:
Plain HTML Outperforms PDF
- Plain HTML showed better precision and recall for both Claude (0.439, 0.433) and Gemini (0.4266, 0.4156).
Multi-Table Sheets Are Costlier to Process
- Cost increased by ~3x to 4x for Plain HTML due to the higher token usage required to represent multiple tables.
- PDF had a smaller cost increase but produced significantly worse results, making it a poor choice despite its lower cost.
Performance Degradation from Single-Table to Multi-Table
- Precision and Recall for Plain HTML dropped by ~50% for both models, but it remains the best choice for multi-table spreadsheets.
- PDFs suffered severe performance degradation with a 75% to 90% drop in precision, making it unusable for practical use cases.
Final Recommendations
- For Single-Table Sheets, use Plain HTML or Markdown for cost-performance balance and HTML with Color Encoding for maximum precision (for Claude).
- For Multi-Table Sheets, Plain HTML is the only viable option. It offers significantly higher precision and recall than PDF, although at a much higher cost.
- Avoid PDF for all cases. The inability of LLMs to interpret table boundaries in PDF results in low precision (as low as 0.0435 for Gemini).
Conclusion
While state-of-the-art LLMs like Claude and Gemini demonstrate strong performance in single-table span detection, their ability to handle multi-table spreadsheets remains limited. The performance drop from single to multi-table detection highlights that even state-of-the-art LLMs still struggle with this task. Without fine-tuning, the LLMs rely solely on the input context, and this context becomes significantly more complex for multi-table sheets. Despite this, Plain HTML and Markdown both serve as the most effective and consistent options, offering the best tradeoff between precision, recall, and cost.
Future advancements in representation strategies, model optimization, or hybrid fine-tuning approaches may be required to bridge this performance gap, especially for multi-table scenarios. Until then, businesses should factor in both cost and performance degradation when considering LLMs for multi-table span detection tasks. As part of our ongoing efforts, we continuously evaluate newer LLMs on this task to monitor whether emerging models are better equipped to handle the challenges of multi-table detection.