

In Part 1 of this series, we ran 40+ controlled experiments to find the optimal text-based RAG configuration: PyMuPDF parsing, fixed-300-token chunking, Gemini Embedding-001, and dense top-10 retrieval. That pipeline achieved NDCG@10 of 0.835 and answer correctness of 0.670 on our UniDoc-Bench subset, a strong baseline for enterprise document Q&A.
Part 2 asks the next natural question that every team building document Q&A eventually reaches: should we feed the LLM page images instead of extracted text? It is one of the most common questions practitioners ask and the answer is more nuanced than a simple yes or no. It depends on which model generation you are using, and how much you care about factual precision versus answer richness.
We tested three paradigms across three Gemini model generations, 9 configurations in total, evaluated on the same 800-question UniDoc-Bench subset used in Part 1. We report quality through LLM judge score, RAGAS correctness, and RAGAS relevancy, alongside cost per query and latency, so every comparison reflects both answer quality and deployment practicality.
The Three RAG Paradigms
Before looking at the results, it helps to clearly distinguish the three paradigms we compared.
- Text RAG answers from retrieved text chunks.
- Visual Generation uses the same text retrieval pipeline, but maps retrieved chunks back to their source pages and sends page images to the VLM for answer generation.
- E2E Multimodal also answers from page images, but differs in one key way: retrieval is done directly over page images rather than text chunks.
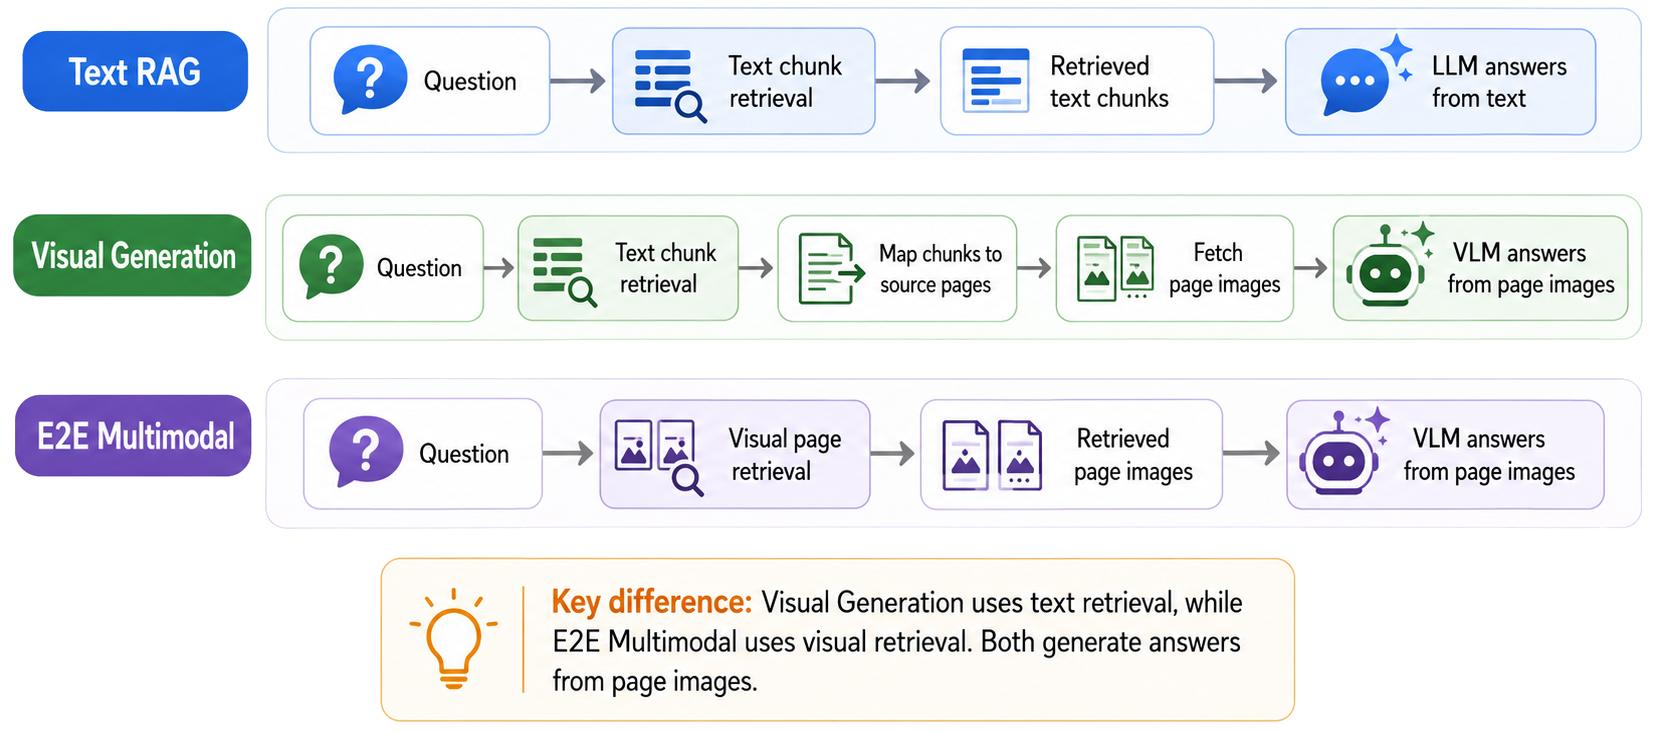
Figure 1. The three paradigms evaluated in this study: Text RAG, Visual Generation and E2E Multimodal
The distinction matters because it separates two different questions. Visual Generation tells us whether answering from page images improves over answering from extracted text. E2E Multimodal tells us whether retrieving those page images visually adds anything beyond text-based retrieval. In other words, if Visual Generation and E2E Multimodal perform similarly, the gain is coming from image-based generation, not from the visual retrieval layer.
The Answer Depends Entirely on Which Model You Use
Visual approaches do not uniformly help or hurt. They start behind text RAG and then cross over it as models improve. The chart below tells this story.
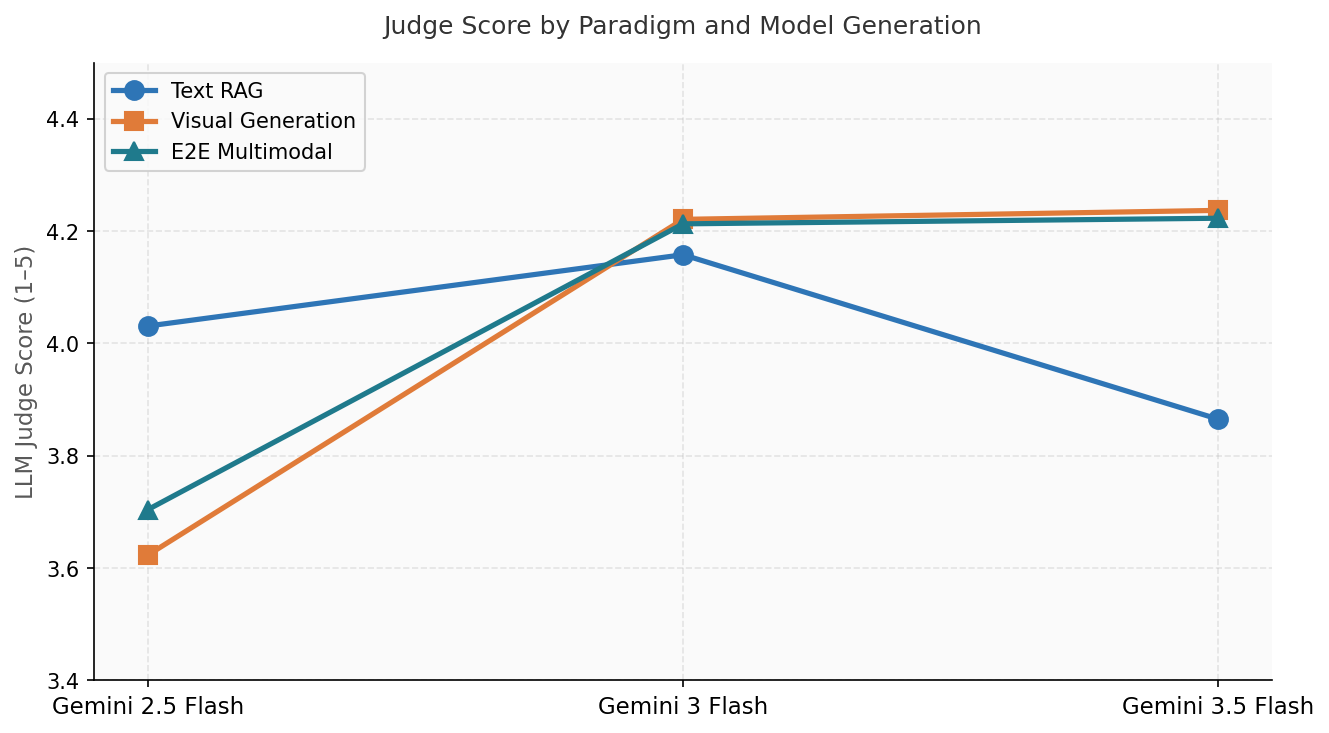
At Gemini 2.5 Flash, Text RAG leads with a judge score of 4.031. Visual Generation scores 3.623 (0.408 points behind). The model is not yet capable enough to reliably read and reason over page images: tables, multi-column layouts, and dense text in image format are beyond its reliable comprehension.
At Gemini 3 Flash, the picture inverts. Visual Generation leaps to 4.221, overtaking Text RAG at 4.158. The VLM capability needed to interpret document layouts, tables, and structure from page images has genuinely improved. From this point on, giving the model the actual page image produces richer, more complete answers, and the LLM judge rewards.
At Gemini 3.5 Flash, the visual lead holds but Text RAG actually declines to 3.865, below its 3-flash score of 4.158. This may be model-specific behaviour rather than a generalizable trend. We observed it consistently across prompts and questions, but the underlying cause is unclear. It warrants deeper investigation before drawing conclusions.
| KEY FINDING |
|---|
| Visual generation is model-generation-dependent. With Gemini 2.5 Flash, stick with Text RAG, the VLM is not yet strong enough to outperform text extraction. From Gemini 3 Flash onward, visual generation produces measurably better answers as judged by humans. The crossover happens sharply, not gradually. |
Visual Retrieval Adds No Quality Over Text Retrieval
If visual generation helps, does visual retrieval help too? The data gives a clear answer: no.
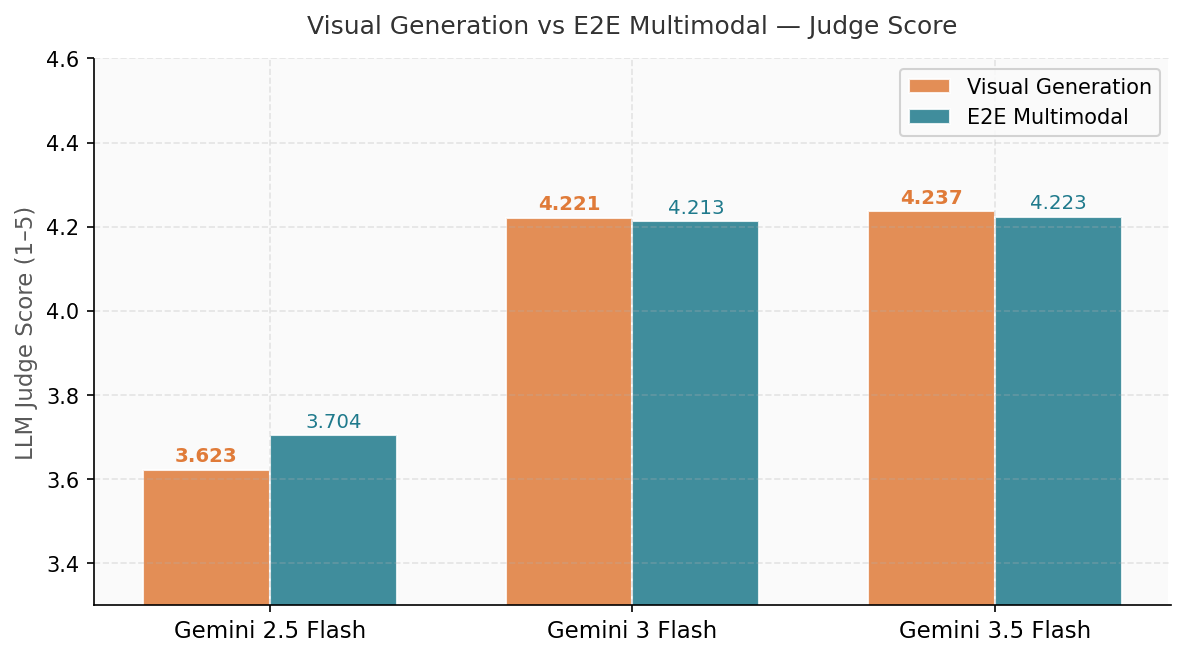
At every model generation, Visual Generation and E2E Multimodal score very close to each other. At 3-flash the gap is just 0.008 points (4.221 vs 4.213); at 3.5-flash it is 0.014 points (4.237 vs 4.223). In practical terms, these are very small differences and do not suggest a meaningful quality advantage for visual retrieval in this benchmark.
At 2.5-flash, E2E Multimodal is actually marginally better (3.704 vs 3.623), but both lag Text RAG significantly at this tier. At the model tiers where visual approaches genuinely win (3-flash, 3.5-flash), the retrieval method makes no difference at all. This result also aligns with our Part 1 retrieval study, where the multimodal embedding model, Gemini-V2 preview, had lower NDCG@10 than the text-only Gemini-001 model used in the standard text retrieval pipeline.
The interpretation is straightforward: the bottleneck in visual document Q&A is the model’s ability to read and reason over images, not how those images were retrieved. Once you have a model capable of visual reasoning, whether you found the page via text embeddings or visual embeddings does not change the quality of the answer it generates.
| KEY FINDING |
|---|
| E2E Multimodal, with its additional visual embedding index and more complex infrastructure, offers no quality advantage over Visual Generation at the model tiers where visual approaches actually work. The quality gain comes entirely from visual generation, not visual retrieval. If you are building a visual pipeline, we found no quality gain from visual retrieval on this evaluated subset. |
Gemini 3 Flash is the Sweet Spot for Visual Pipelines
With 3-flash confirmed as the point where visual generation becomes worthwhile, the next question is whether upgrading to 3.5-flash is justified. The data says no.
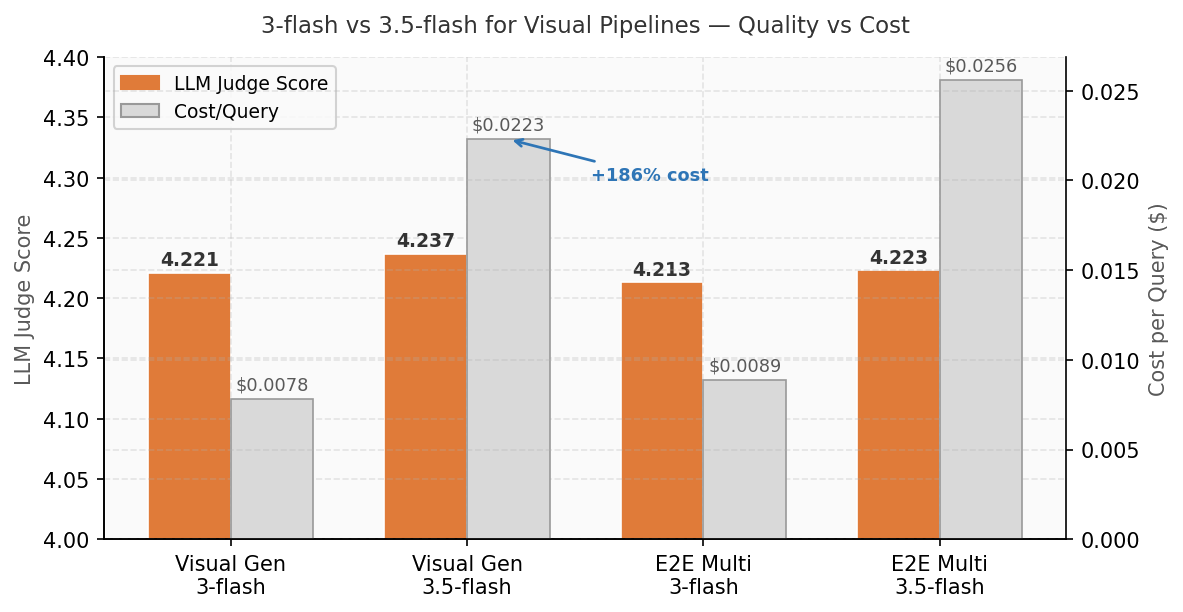
Going from Gemini 3 Flash to Gemini 3.5 Flash on Visual Generation adds 0.016 judge points (4.221 → 4.237). The cost goes from $0.0078 to $0.0223 per query, a 186% increase. On E2E Multimodal the story is the same: 0.010 judge point gain at 188% higher cost.
To put this in business terms: at 10,000 queries per day, the difference between 3-flash and 3.5-flash for Visual Generation is roughly $45/day versus $146/day, for an answer quality improvement that most users would not notice. The 0.016 judge point gap is not perceptible in practice.
| KEY FINDING |
|---|
| For image-based generation pipelines, Gemini 3 Flash appears to offer the best quality-to-cost balance in this study. It captures nearly all of the observed quality gain from visual understanding at a much lower cost than 3.5-flash. Based on these results, upgrading to 3.5-flash for visual pipelines may be difficult to justify on quality grounds alone. |
Text RAG Still Leads on Factual Precision
The judge’s score tells one story. The RAGAS Correctness metric, which measures strict factual accuracy by decomposing answers into claims and checking them against reference answers, tells a different one.
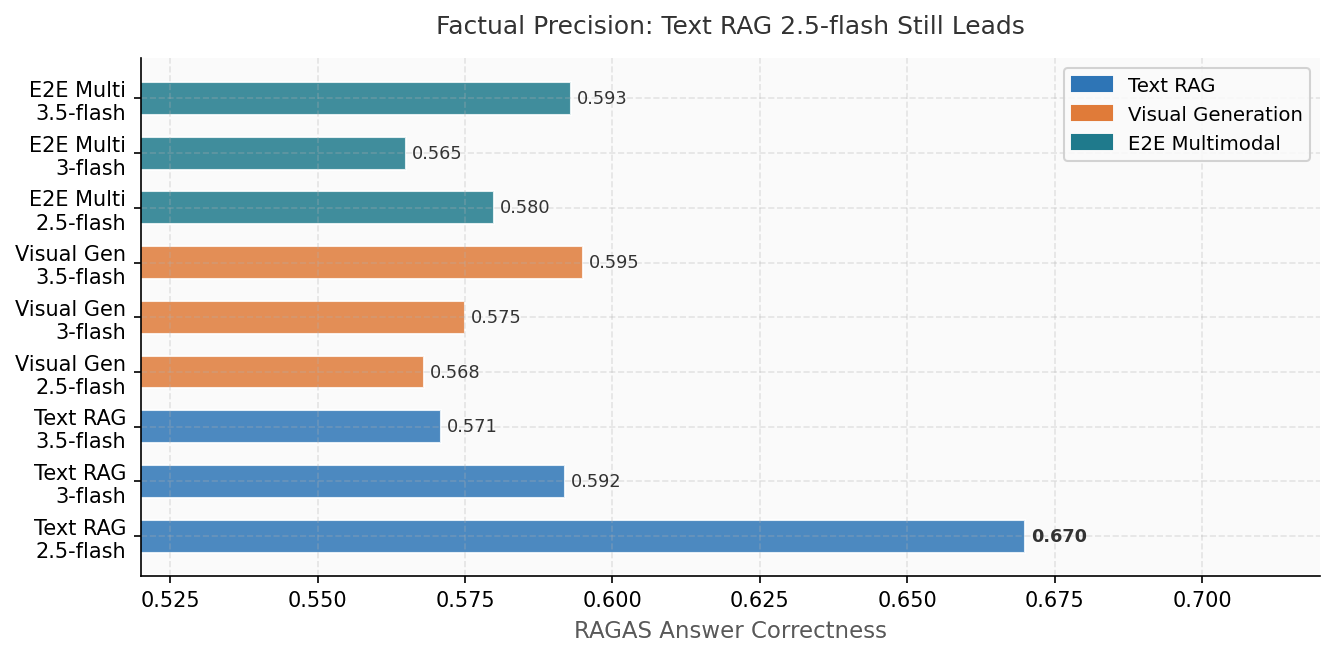
Text RAG with Gemini 2.5 Flash achieves RAGAS Correctness of 0.670, the highest of all 9 configurations in this study. Visual approaches range from 0.565 to 0.595, consistently below Text RAG. Crucially, even upgrading the model does not help: Text RAG at 3-flash drops to 0.592, and at 3.5-flash to 0.571.
This is not a contradiction of Finding 1, it reflects a genuine difference between two things being measured. The LLM judge rewards answer richness and completeness: well-structured, contextually complete responses. RAGAS Correctness rewards factual precision: concise, exact answers that match the reference closely. Visual generation produces richer, more narrative answers that judges rate highly. Text RAG produces tighter, more precisely extracted answers that score better on strict accuracy metrics.
Which matters more depends on your use case. For customer-facing Q&A where answer quality and fluency matter, visual generation at 3-flash or above is the stronger choice. For compliance, audit, or any context where factual precision and exact extraction are critical, Text RAG with Gemini 2.5 Flash remains the strongest option in this study.
| KEY FINDING |
|---|
| Text RAG 2.5 Flash has the highest factual correctness (0.670) of all 9 configurations — visual and newer-model approaches produce richer answers that score higher on human judgment but lower on strict accuracy. The right choice depends on whether your use case prioritises answer richness or factual precision. |
Visual Approaches Answer the Question More Directly, But Only at 2.5-flash
RAGAS Relevancy measures how directly an answer addresses the question asked, independent of whether it is factually correct. The trend here tells a different story from both the judge score and correctness metrics, and is worth understanding.
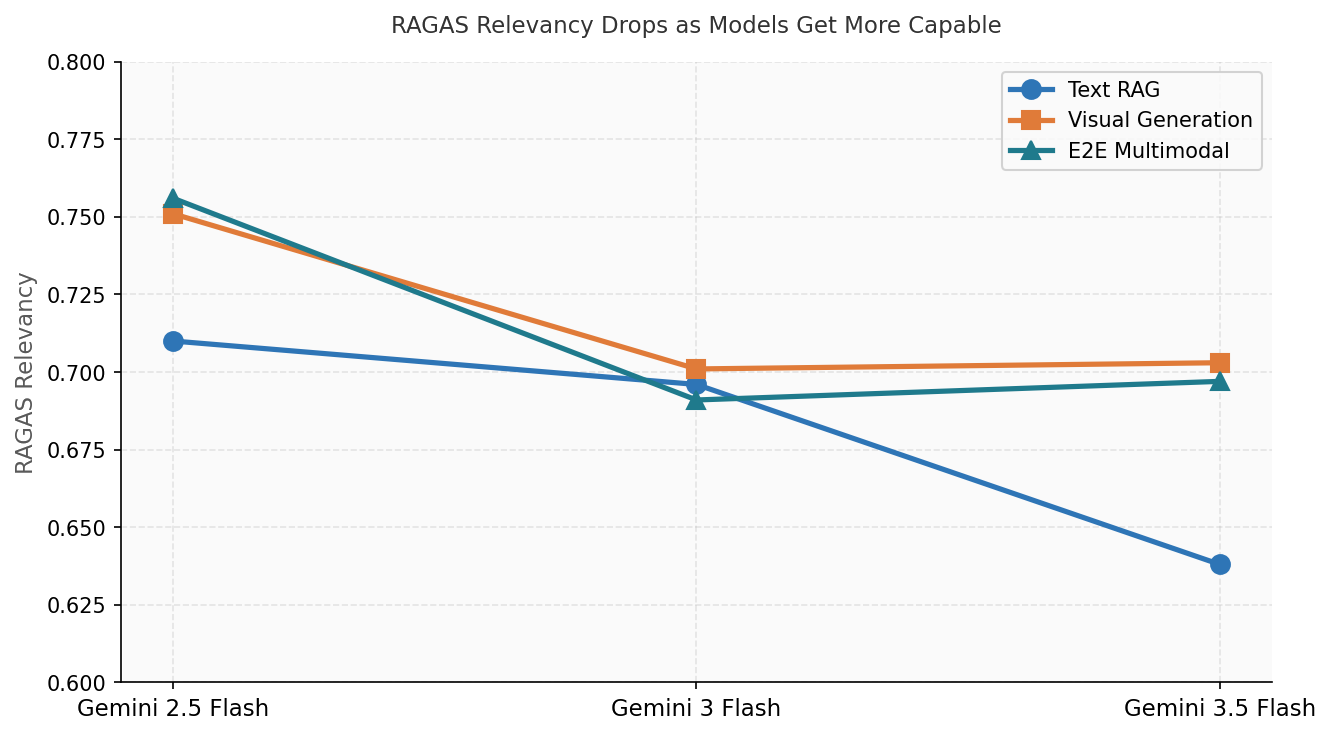
At Gemini 2.5 Flash, visual approaches score higher on relevancy than Text RAG (0.751–0.756 vs 0.710), despite scoring lower on both judge score and correctness. This suggests that even at a model tier where visual understanding is limited, the VLM tends to stay more focused on the question being asked. The issue at 2.5-flash is not that the model ignores the question, it is that it cannot read the page image accurately enough to answer it correctly.
At Gemini 3 Flash, relevancy converges across all three paradigms (0.691–0.701). The VLM capability gap closes and with it the relevancy advantage of visual approaches. At 3.5-flash the pattern is similar, all three sit between 0.638 and 0.703, with Text RAG now trailing slightly due to model verbosity on text-only contexts.
| KEY FINDING |
|---|
| At 2.5-flash, visual approaches are more question-focused (higher relevancy) but less accurate (lower correctness), they address the right topic but get the facts wrong. This is a different failure mode from Text RAG, which extracts correctly but sometimes drifts. At 3-flash and above, the relevancy gap disappears and visual approaches win on all dimensions except factual precision. |
Quality, Cost, and Latency Together
No deployment decision should be made on quality alone. The bubble chart below plots all nine configurations on quality vs cost, with bubble size representing latency, giving business teams the full picture alongside the technical findings.
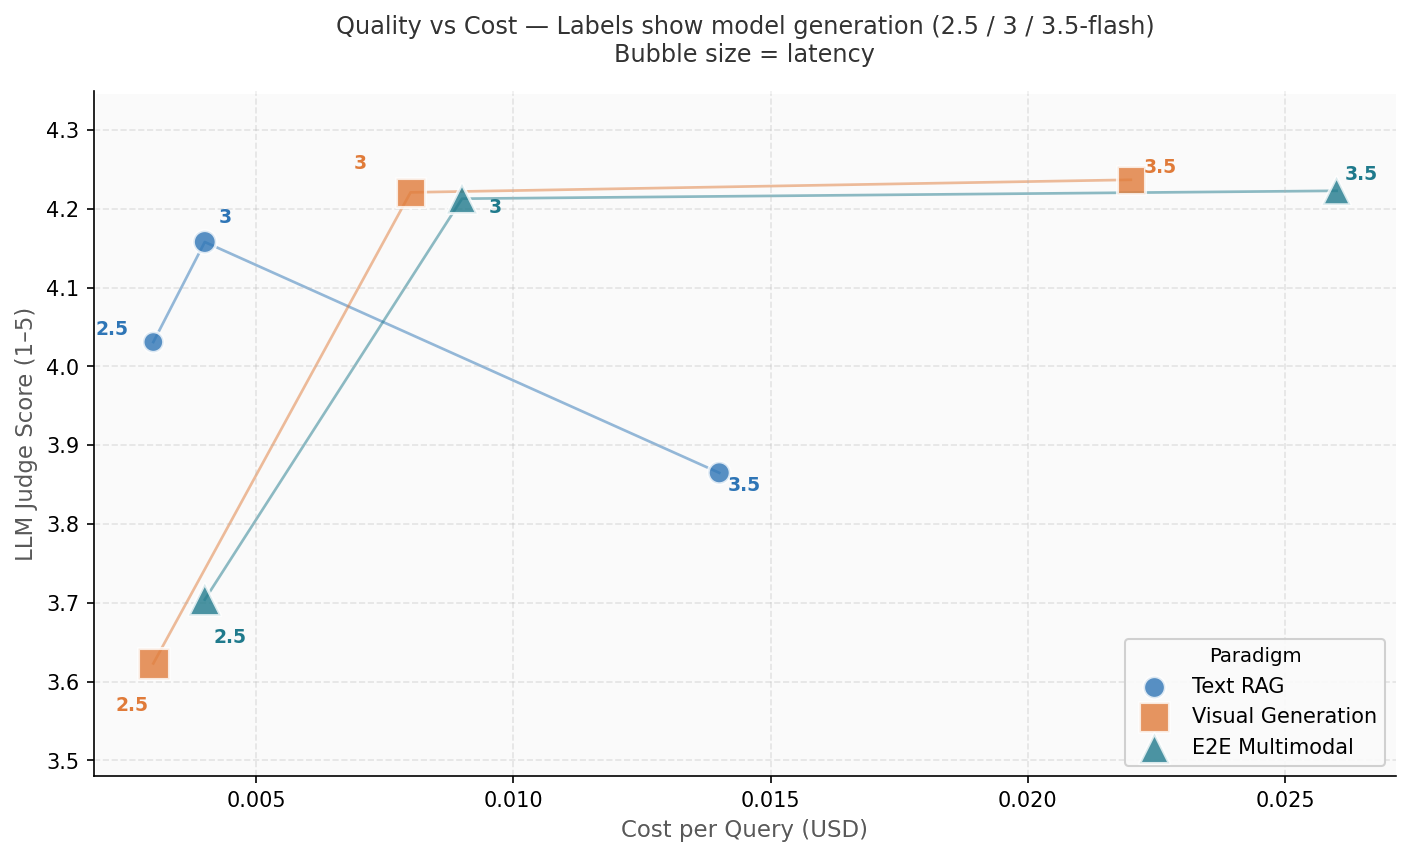
Three patterns stand out:
1. All visual approaches have roughly 2× the latency of Text RAG (8–11s vs 4–6s) due to image encoding overhead, a significant consideration for interactive applications.
2. Text RAG 2.5-flash occupies a unique position: lowest cost ($0.003/q), lowest latency (4.5s), and highest factual correctness.
3. E2E Multimodal sits to the right of Visual Generation at every model tier, higher cost, no quality gain.
Decision Guide
Based on these findings, here is how different teams should think about the choice between Text RAG and visual approaches:
| If your priority is… | Use this | Judge / Correctness | Cost/ Query | Why |
|---|---|---|---|---|
| Factual precision / compliance | Text RAG + Gemini 2.5 Flash | 4.031 / 0.670 ★ | $0.003 | Highest correctness, lowest cost, fastest at 4.5s |
| Answer richness / UX | Visual Gen + Gemini 3 Flash | 4.221 / 0.575 | $0.008 | Best quality-to-cost ratio for visual |
| Image-rich / layout-heavy docs | Visual Gen + Gemini 3 Flash | 4.221 / 0.575 | $0.008 | VLM reads charts, tables, diagrams text extraction misses |
| Simplest infrastructure | Text RAG + Gemini 2.5 Flash | 4.031 / 0.670 | $0.003 | No visual pipeline needed, lowest complexity |
| Avoid — | E2E Multimodal (any tier) | ≈ Visual Gen | +15–20% | Same quality as Visual Gen at higher cost and complexity |
| Avoid — | Visual Gen + 2.5-flash | 3.623 / 0.568 | $0.003 | VLM not capable enough; Text RAG wins at this tier |
| DISCLAIMER |
|---|
| All findings are based on a filtered subset of Salesforce UniDoc-Bench: 800 questions (text_only + table_required), 545 source PDFs, 7,403 pages across 8 English business domains. Results may differ across different document types, languages, or at larger corpus scales. Model rankings are tied to specific versions tested and may change with future releases. Costs computed from token counts using API pricing at time of experiment (June 2026). Treat these as directional findings and validate on your own data. |
| UP NEXT — PART 3 |
|---|
| Vectorless RAG: Replacing Embeddings with Iterative BM25 Search What if you threw out the embedding infrastructure entirely and let the LLM issue keyword searches, read the results, and decide whether to search again? We built and benchmarked exactly this and at the right model generation, it beats every pipeline in this series. Coming in Part 3. |