2.5 quintillion bytes of data are generated per day, which continues to accelerate given the needs and demands of society. It is one of the most powerful and pivotal resources when refined and used. There are several approaches to comprehending data depending on its nature, the requirement, and the kind of information we want to extract from it. The advancements in technology and the incorporation of artificial intelligence (AI) into workflows have made data processing easier and more effective. What statistical and mathematical techniques are to numerical data, Natural Language Processing, more specifically, Knowledge Graphs are to textual data.
Natural language processing, simply put, allows computers to analyze, process, interpret, and recognize patterns in human speech and text. It is a subfield of AI that is concerned with giving computers the ability to interact with humans the way humans do. Combining computational linguistics, rule-based modeling of human language, statistics, machine learning, and deep learning models, it enables computers to process human language in voice or text to comprehend its full meaning, including intent and sentiment. Just as humans have different sensory inputs from their eyes and ears, computers can be programmed to read microphones to collect audio inputs. The way human brains process inputs, computers can be programmed to process respective inputs. During the processing, the inputs are converted to code that the system understands. Since the amount of content available on the internet is ever-expanding, search engines have to comb through billions of websites to serve useful information with great precision and speed. This is the part where knowledge graphs come in handy.
What are Knowledge Graphs?
A knowledge graph is a way of storing data resulting from an information extraction task. It organizes data from multiple sources, captures information about entities of interest in a task, and forms connections between them. Since a knowledge graph has no formal definition, it is usually considered a semantic network with added constraints. A knowledge graph is a directional, semantic network that represents relationships between named entities. It comprises three primary components - nodes, edges, and labels. In linguistic terms, this would be the subject-predicate-object triplet, where the predicate indicates the relationship between an entity pair. Combining knowledge graphs with machine learning improves the accuracy of systems and extends the range of machine learning capabilities, offering better explainability and trustworthiness.
In data science, knowledge graphs are used to facilitate access and integrate data sources, add depth to data-driven AI techniques, and serve as bridges between human and computer systems. It deals with the interconnectedness of entities, which are nodes connected via edges. These entity pairs can be tracked to discover meaningful connections even in unstructured data. For instance, we know dogs are mammals.
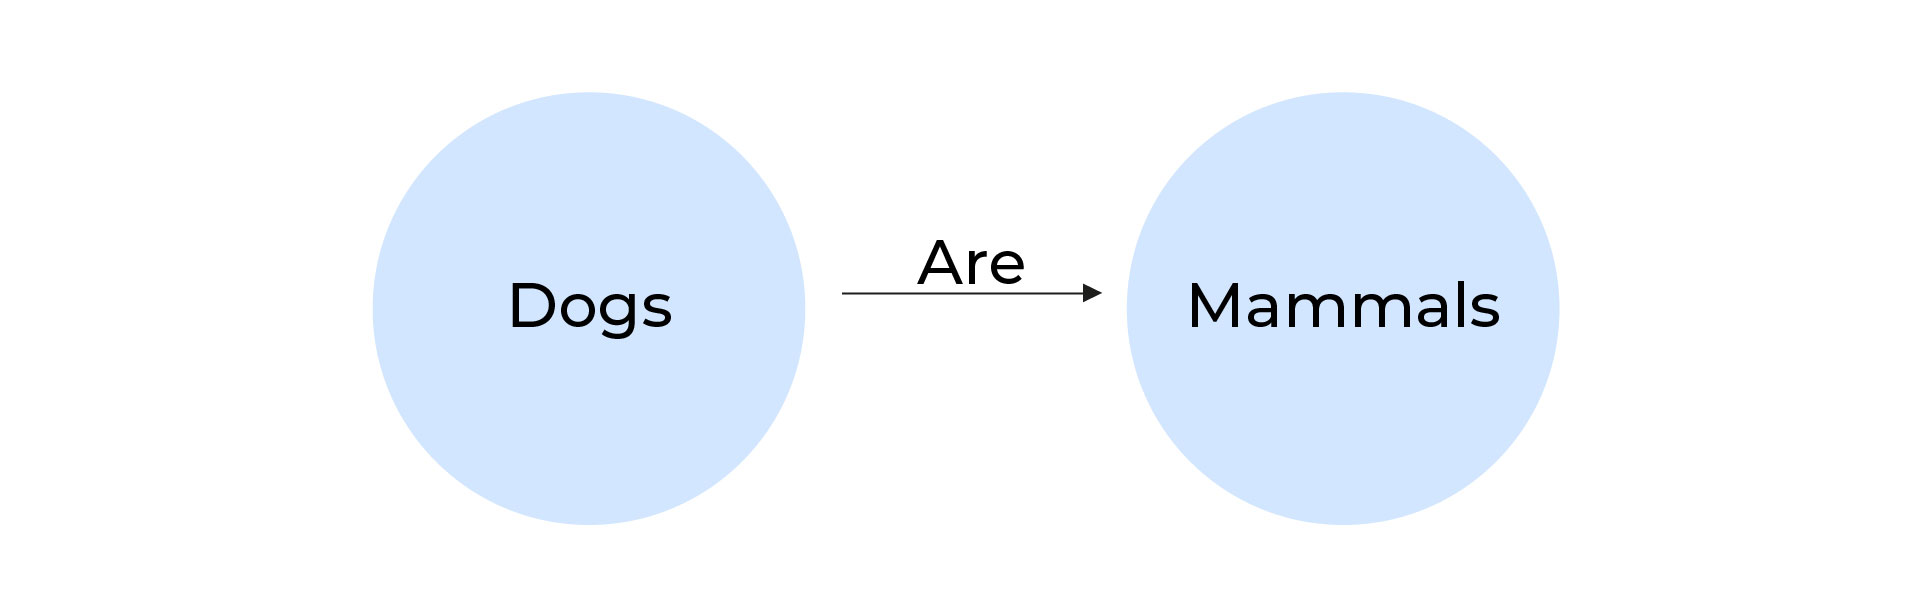
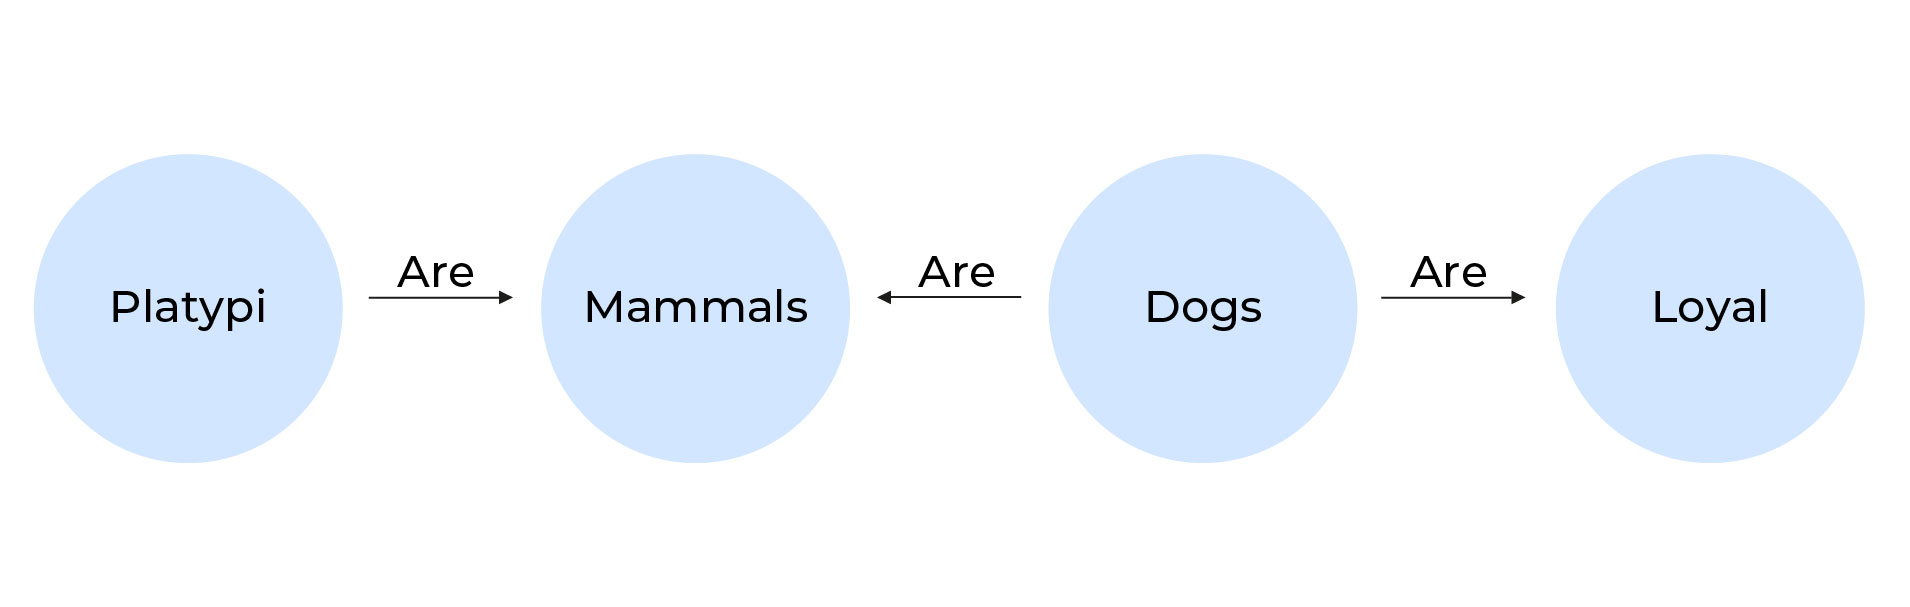
Here “Dogs” and “Mammals” are two nodes related through the edge “are”. The emergence of relationships isn’t confined to only the first node, they can emerge from anywhere in the graph, making it versatile and potentially vast. Each node can be mapped to other nodes, such as dogs are loyal and platypi are also mammals.
Extracting Insights using Knowledge Graphs
Since knowledge graphs closely emulate the principles of English grammar, the first step in the creation of these graphs is sentence segmentation. A corpus of text is broken down into individual sentences, which are further divided to obtain the crux of the text. If we take the following corpus of text - “PV Sindhu, laurelled Woman’s Singles Badminton Player, says she intends to regain fitness before the BWF Tour Finals. She is still recovering from the stress fracture on her left ankle which she suffered during the Commonwealth Games 2022.” - it would be paraphrased into the following two sentences:
“PV Sindhu intends to regain fitness before the BWF Tour Finals.”
and
“She injured her left ankle during the CW Games 2022.”
These would then be used by the graph to represent in the form of nodes.
The next logical step is the extraction of entities, i.e, the identification of words from a sentence. Parts of the speech are tagged with emphasis on nouns and proper nouns. A technique known as ‘Dependency Parsing’ is used to build a parsing tree to establish relationships between entities, as opposed to using grammatical rules. This offers flexibility in terms of syntax and allows the model to understand sentences despite being grammatically incorrect. For instance, “bright light” and “light bright” both would be interpreted the same and the model can account for any missing state of verbs.
The final step is the Extraction of Relationships. In order to connect the nodes to one another, the root (the verb) is localized and paired with the subject to create a comprehensive picture. These graphs use ontology as a schema layer which allows logical inference for retrieving even knowledge that is implicit or masked rather than only allowing queries requesting explicit, straightforward knowledge. This makes it an excellent tool to deepen understanding and convert it into actionable insights.
Data Extraction from Corpus of Text
Entity extraction and relation extraction from the text are two fundamental tasks in natural language processing. The extracted information from multiple portions of the text needs to be correlated, and knowledge graphs provide a natural medium to accomplish such a goal. For example, from the sentence shown in the top half of the image below, we can extract the entities Albert Einstein, Germany, Theoretical Physicist, and Theory of Relativity; and the relations born in, occupation, and developed. Once this snippet of the knowledge graph is incorporated into a larger knowledge graph, we get additional links (shown by dotted edges). For instance, a Theoretical Physicist is a kind of Physicist who practices Physics, and the Theory of Relativity is a branch of Physics.
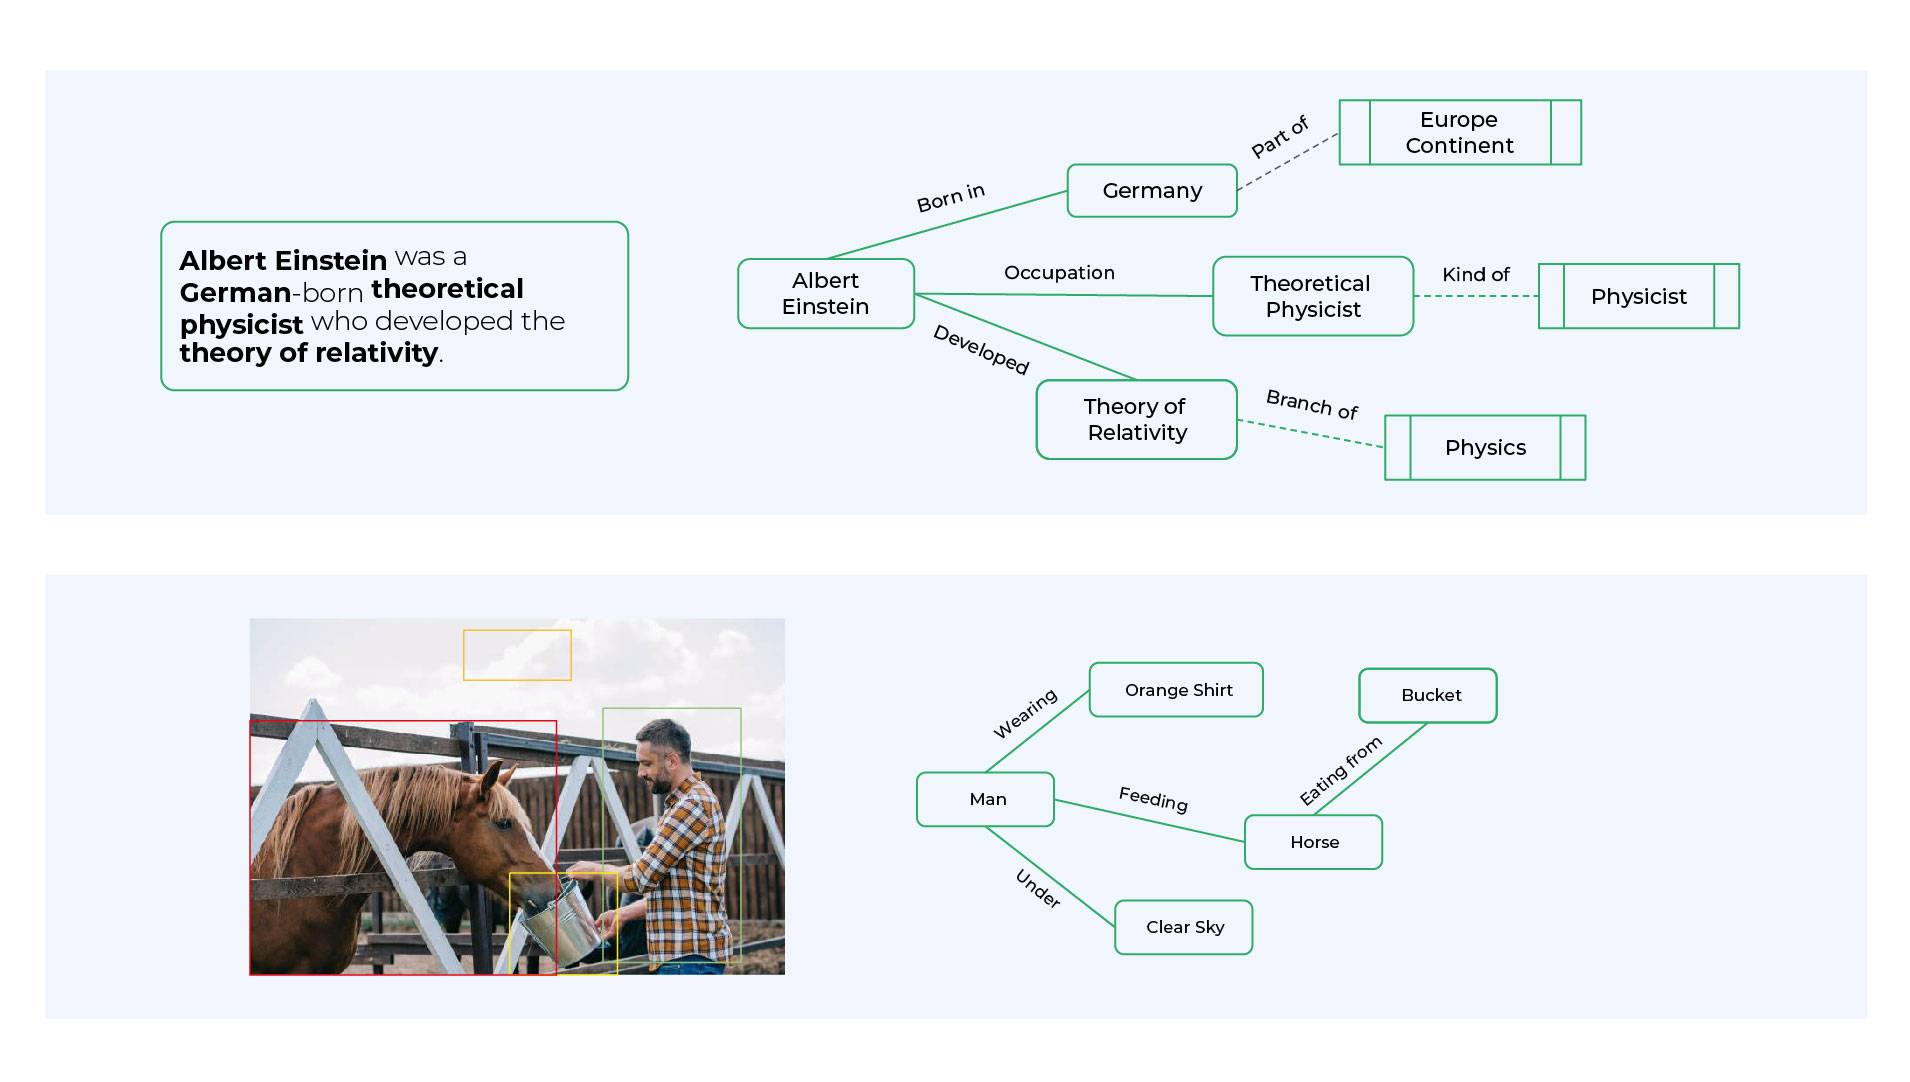
Entity Extraction from Image
Knowledge graphs not only extract data points from the corpus of text, but also from images. From the image shown above, an image understanding system should produce a knowledge graph shown to the right. The nodes in the knowledge graph are the outputs of an object detector. Current research in computer vision focuses on developing techniques that can correctly infer the relationships between the objects, such as the man holding a bucket, a horse feeding from the bucket, etc. The map shown to the right is an example of a knowledge graph.
Knowledge graphs are the epitome of versatility. They transform large amounts of data into intuitive insights. They can be tailored to cater to specific business requirements across industries. Aiding in pharmaceutical research, providing market intelligence reports of competitors, fraud analytics for financial firms, product recommendations for e-commerce, customer behavior understanding, operational risk, supply chain management, and mapping are just a few possibilities. This allows businesses to explore tangible areas for growth and exacerbate understanding.
High-Level General Solution Approach
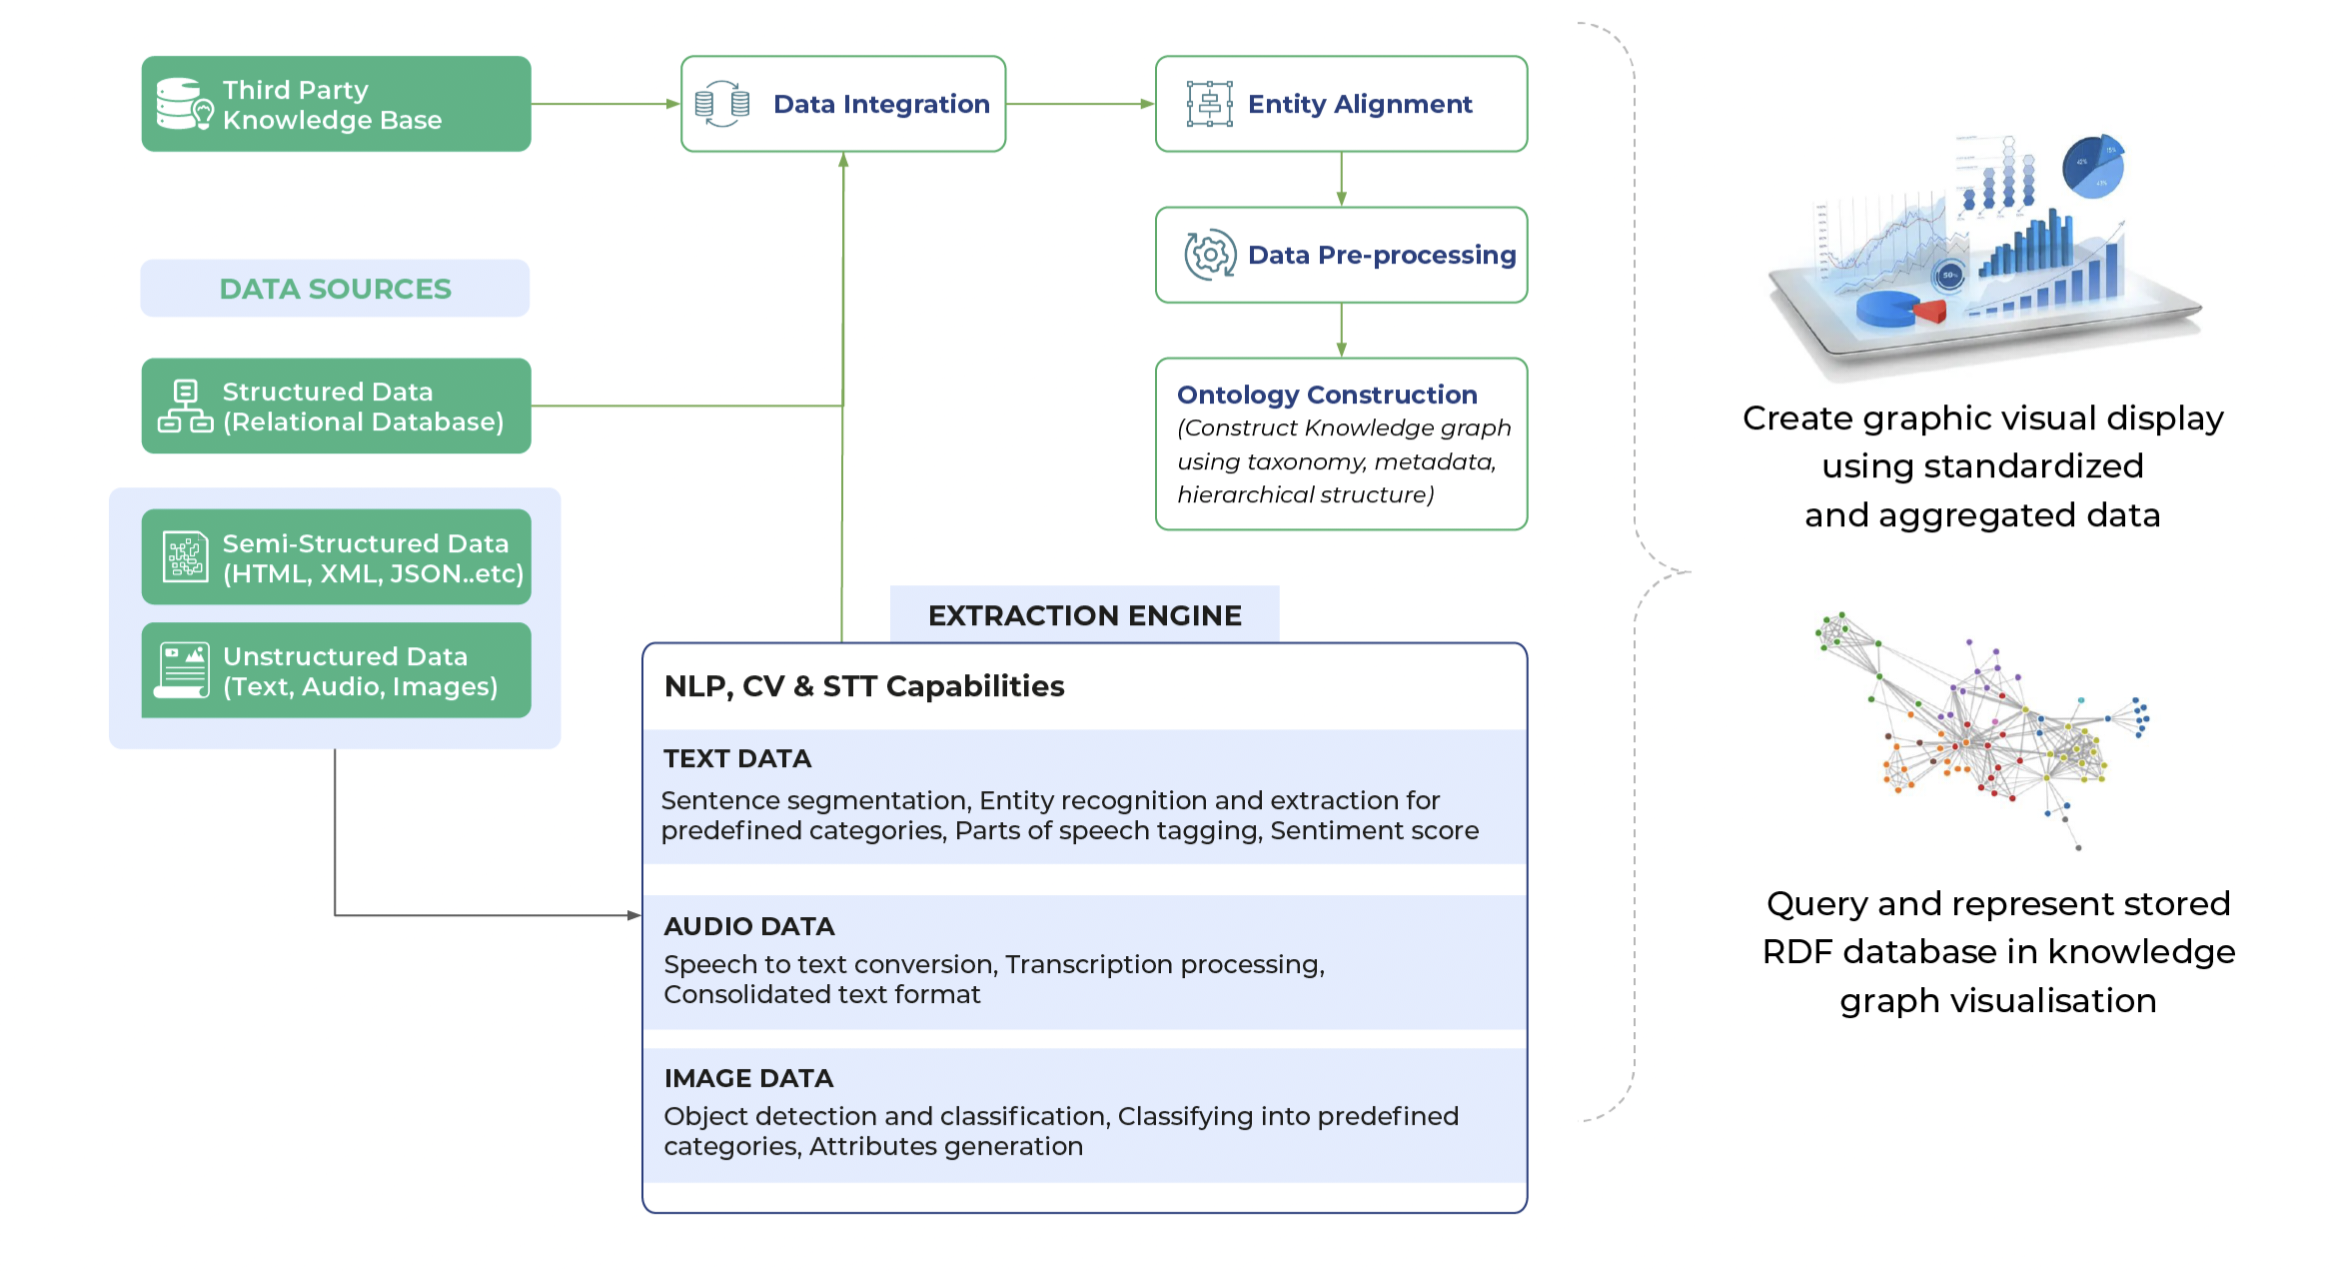
The two rudimentary, foundational elements needed for a knowledge graph to work are a knowledge base and data sources, irrespective of structure or its lack thereof. Another integral component in an extraction engine is created using NLP, STT (Speech-To-Text), and CV (Computer Vision) capabilities as required to extract varied data.
Audio data is extracted using STT conversion and transcription processing, while image data is understood using object detection, classification, and attribute generation.
These elements are integrated to align entities, pre-process data and construct ontologies using taxonomy, metadata, and hierarchical structure.
These knowledge graphs are then visualized.
The Dow Jones Story
Several approaches to knowledge graphs have been around since the beginning of modern AI in areas such as knowledge representation, knowledge acquisition, ontology engineering, semantic web, and so on. But the term knowledge graph was introduced by Google in 2012 to refer to its general-purpose knowledge base. The knowledge graphs are used extensively across systems from search engines and chatbots to product recommenders and autonomous systems. In data science, common use cases are around adding identifiers and descriptions to data of various modalities to enable sense-making, integration, and explainable analysis.
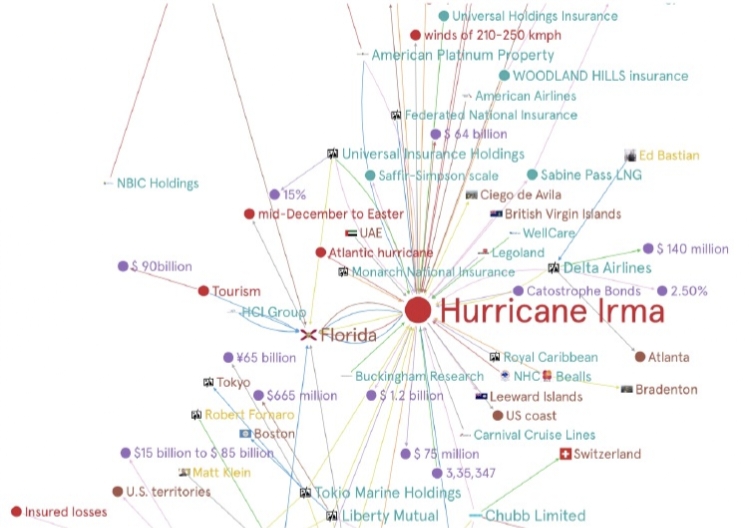
Dow Jones & Company, publishers of the Wall Street Journal, has over 1.2 billion new articles in multiple languages spanning three decades. They are renowned across the world for their superlative analysis and insight on anything business and finance. The company sought for a solution to quantify network effects and business impacts on real-world events. One such event was Hurricane Irma, a category 5 hurricane in 2017. As CNN described it, “No word seems strong enough to describe Hurricane Irma — one of the most powerful storms ever seen in the Atlantic.” The impact in terms of economic loss was a whopping $70 billion, as estimated by Moody’s Analytics.
Quantiphi, in collaboration with Google, built an advanced solution leveraging Knowledge Graphs to visualize the aforementioned problem. The state-of-the-art Natural Language Understanding algorithms were employed to extract named entities and relations, and resolve co-references to infer implicit relationships between entities. This enabled the model to comprehend the intricacies of the event in question and, therefore, uncover covert opportunities and hidden relationships which ultimately resulted in the expansion of business.
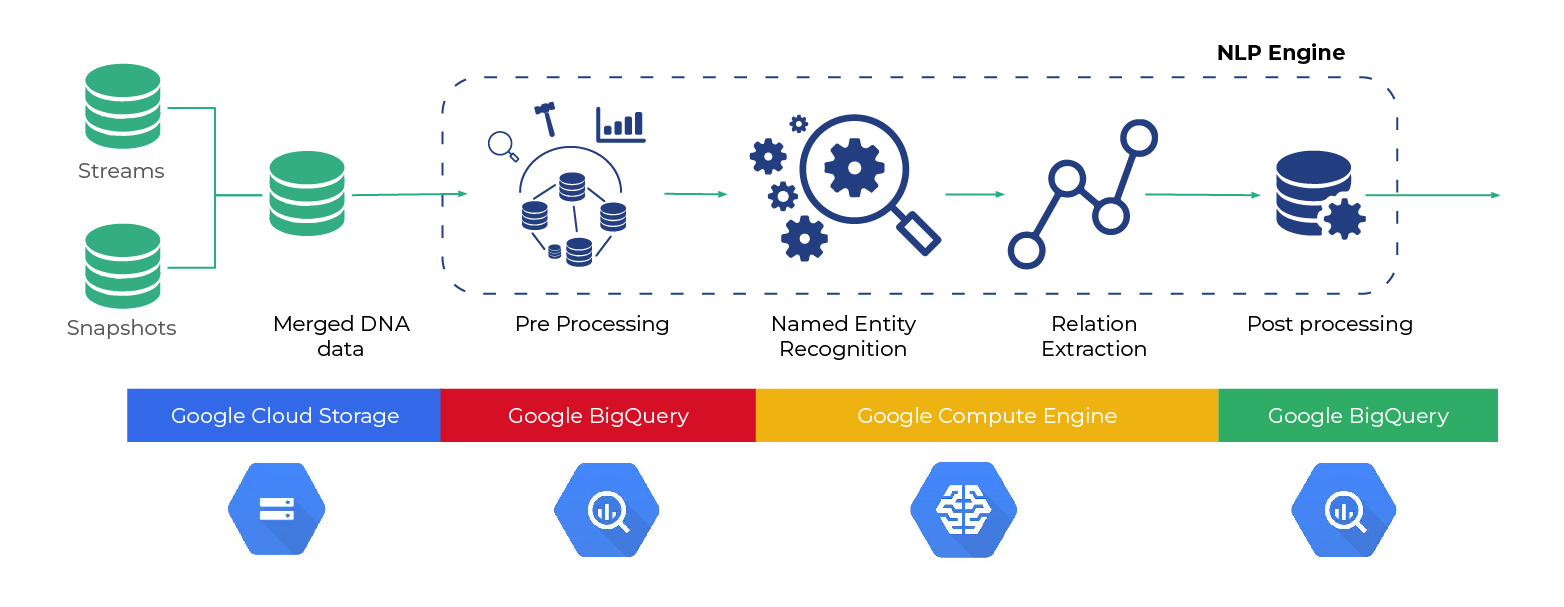
The solution was entirely set up on GCP with the capacity to support end-to-end data ingestion, cleaning, pre-processing, relation extraction, and visualization. Classified into two broad components - Infrastructure and NLP, the former leveraged services such as Cloud Storage, DataPrep, BigQuery, Translation API, and Compute Engine. It also leveraged TensorFlow and a graph database platform to perform text mining, machine learning, data integration, and visualization of findings.
The model provided a framework for assessing qualitative business impacts of rare events from unstructured data and facilitated insight extraction from complex news data. The visualization framework was intuitive, making exploring critical insights easier. It also drastically reduced time consumed in both processing data and understanding the impacts from news articles. A demo of the solution can be accessed here.
Though knowledge graphs have their own set of challenges, they are one of the easiest tools to set user expectations for search systems across enterprises. With applications across industries, starting from retail to healthcare, knowledge graphs solve several business challenges. For retailers, knowledge graphs can be used to make recommendations based not only on individual behavior, but also based on purchase trends across demographics. Entertainment and OTT platforms can analyze click and other online engagement behavior to recommend new content for users. In the healthcare industry, knowledge graphs organize and categorize relationships within medical research. This, in turn, validates diagnoses and identifies individual treatment plans. Despite industry, Quantiphi can help you build your own knowledge graph from data derived from structured or unstructured sources from various business domains. To get started, or learn more, get in touch with our experts.


