Think about the last time you went to the nearest shopping mall or departmental store. Most likely, you would have entered with a fixed shopping list in mind but ended up buying a lot more. We often make impulsive decisions to shop for products that we don’t need but the want is created once we see them in the store. This consumer behavior plays a pivotal role in driving sales for retail companies. Studies have shown that, on average, shoppers visiting stores tend to spend more than online shoppers. Around 40% of in-store customers spend more than they had planned compared to just 25% of online shoppers.
The COVID-19 pandemic has kept people confined to their homes, drastically impacting their buying behavior. With an increase in online shopping, consumers have become used to hyper-personalization offered by the major e-commerce platforms. Historically, the e-commerce industry has provided more sophisticated personalization and targeted recommendations than brick-and-mortar retail. However, the post-pandemic future will witness the entire consumer landscape expecting a similar personalized in-store experience. To keep up with increased consumer expectations, companies need to adopt transformational technologies to achieve localization in retail merchandising.
Localization

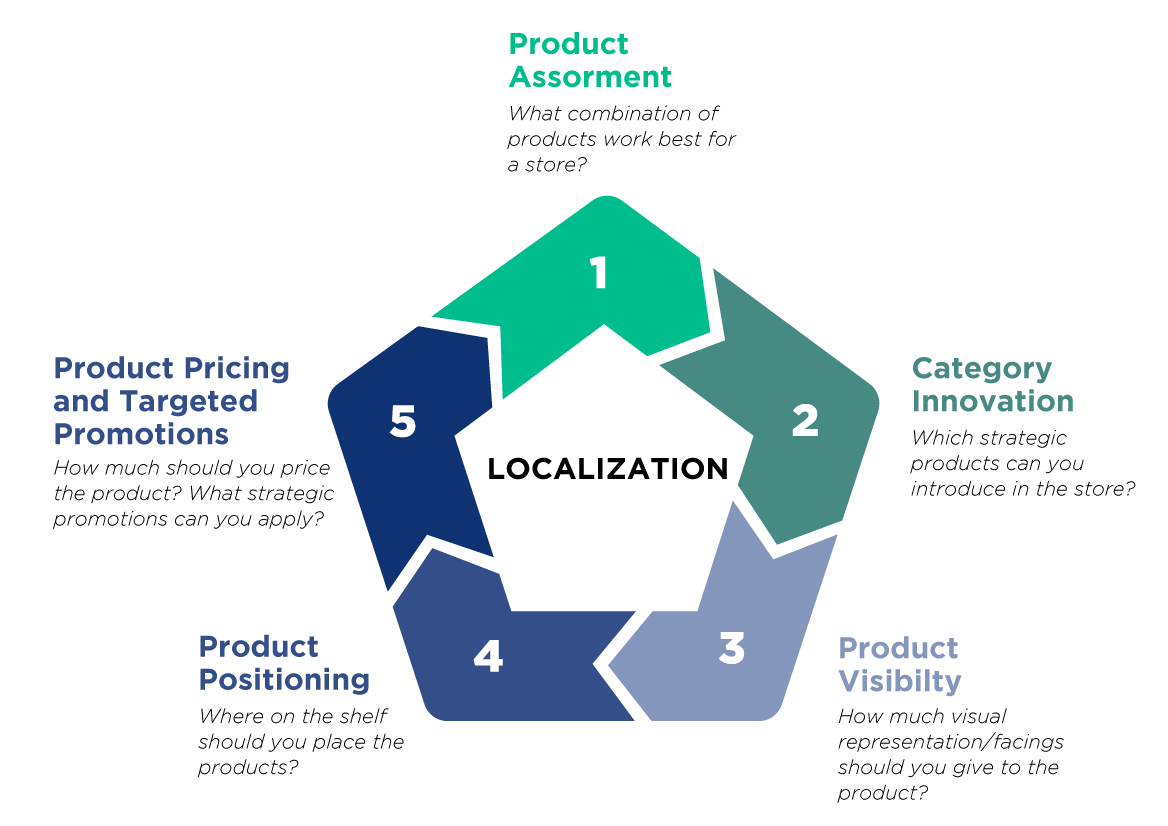
AI solutions in retail can enable brick-and-mortar retail merchandisers to cater to a broad consumer demographic with varying demand, thus delivering a personalized shopping experience. This blog explains five major areas that localization benefits.
Product Assortment - Clustering
What combination of products works best for a store?

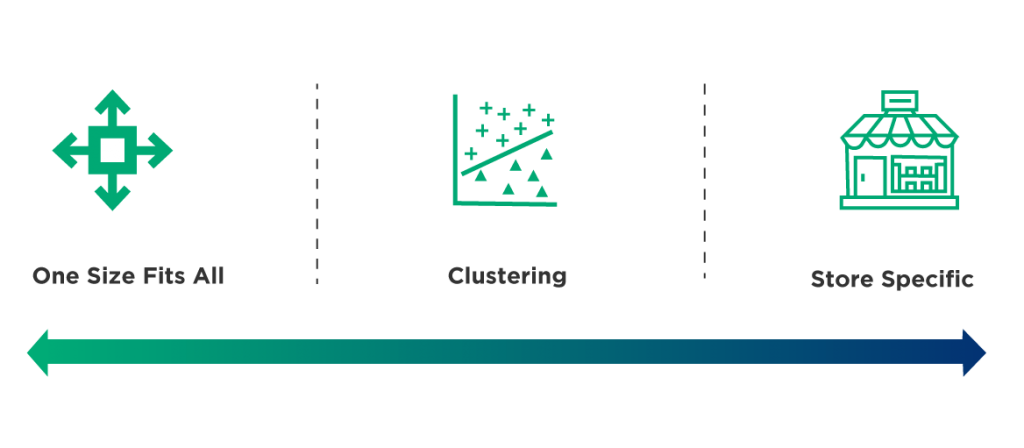
Choosing the correct product assortment for a store is a spectrum of granularity. Companies that choose the ‘one size fits all’ approach generate product assortment centrally, thereby failing to cater to varying consumer needs. Going for a store-specific assortment seems ideal in theory but it becomes cumbersome for merchandisers to achieve in-store execution accurately at a large scale. Clustering or grouping of similar stores is a favorable middle ground between the two extremes.

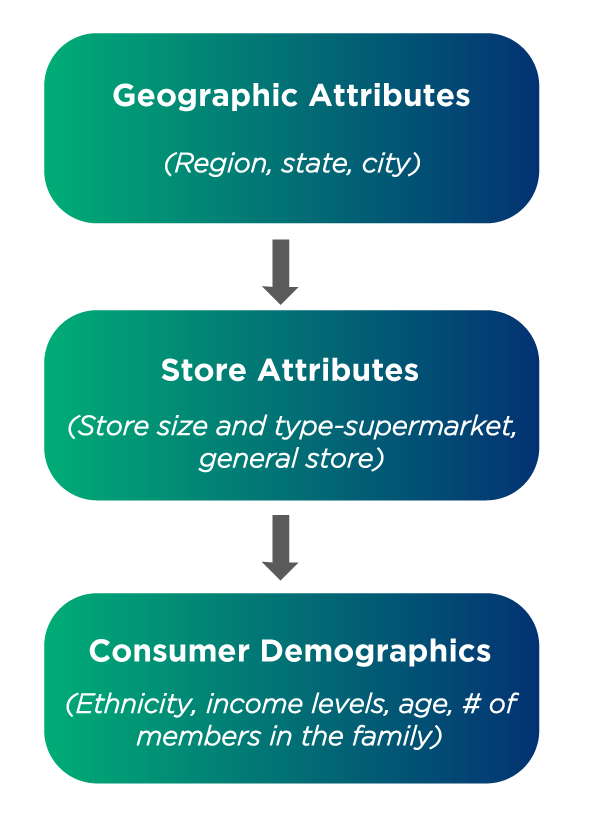
Traditionally, retail companies adopt a top-down clustering approach where fixed criteria and business rules are used to group similar stores. An example of a top-down clustering approach is shown in the figure.
Though this approach solves the localization objective to some extent, it restricts the cluster formation to a fixed set of rules based on assumptions rather than being data-driven.
For example, all supermarkets located in a particular city and having a high percentage of Caucasian mid/low-level income local population will be grouped. By defining such fixed criteria, companies run a risk of missing out on key consumer trends affected by factors that were initially not envisioned. It even handicaps companies to explain outliers (stores whose demand does not typically match its family).
AI can be leveraged for this use case to achieve a data-driven approach to clustering. Cluster formation based on behavioral similarities of stores works far better than assumption-based grouping. AI models look at store-level sales data to observe demand patterns and group stores with similar demand patterns. After the cluster formation stage, geographical, store, and consumer attributes mentioned above are used as an overlay on top of the clusters to obtain deeper insight into the clusters formed.
In this approach, the starting point of cluster formation is data-driven where the attributes and demographics play only a supporting role. Now the model can capture key consumer trends which would have been missed in the top-down approach. It also provides flexibility in the granularity sought according to business rules. For example, the number of clusters formed can be user-defined or tuned to achieve an optimal level of granularity.
Category Innovation - Identify Opportunities
Which strategic products can you introduce in the store?
After clustering stores, the demand patterns of individual product categories for a store can be compared with the category demand for its cluster family. This helps companies identify opportunity gaps and introduce new strategic products to boost sales in stores that are presently underperforming at a product category level.
For example, let us consider that the detergents product category for a cluster family has a high overall sales average. If a store within the same cluster has a comparatively low sales average, it suggests that the store is under-selling detergents. Using this insight, merchandisers can introduce strategic detergent brands in the store to subsequently boost sales.
Product Visibility/Number of Facings
How much visual representation/facings should you give to the product?
Once the product assortment is decided for a cluster of stores along with incorporating innovation/strategic products, planogram design is the next step. Planogram is a visual representation of how products in a store should be placed on shelves to maximize sales. It is a visual representation of the products designed to persuade you to buy more than you planned before visiting the store.
Planogram design and analysis are best done at an individual store level as the store size and number of shelves/facings vary across stores. The facings for each product is calculated based on various factors like:
- Product productivity per facing - How much revenue is the product generating for each facing it occupies?
- Fair share index - Does the product have its fair share of visual representation in the category with respect to its market share?
- Product velocity - How frequently does the product need to be restocked from the backroom inventory?
Product Position
Where on the shelf should you place the products?
Product position plays a crucial role in catching shopper attention. For example, shelves located at eye level usually have higher traction than the ones located at the bottom. Along with the number of facings for each product, a planogram also defines where it should be placed.
Three important factors that impact the product attracting the 'shopper eye' are:
- Shelf location: Which area within the store is the display/shelf located?
- Product position: What should be the product position within the shelf/display?
- Product adjacencies: Which products should be placed together?
A sequence template that defines product positions and their adjacencies can programmatically replicate these strategic decisions for each planogram. By overlaying this template with the number of facings for each product, the planogram design process is automated at a store level.
Product Pricing and Targeted Promotions
How much should you price the product? What strategic promotions can you apply?
Localization also enables retail companies to adopt a dynamic pricing strategy instead of keeping a uniform price for all. Selected pricing and targeted promotions based on clusters can boost sales and maximize revenue. Following are examples where localization can be utilized:
- The same product can be sold to high-value and large chain stores at a higher price than smaller low-value stores.
- A cluster identified to have a premium consumer demographic can be offered targeted promotions on premium brands, whereas a mid/low-income consumer demographic cluster can be offered economy promotions.
Conclusion
The brick-and-mortar sector needs to keep pace with the increasing consumer expectations and revolutionary advances in the personalized shopping experience provided by e-commerce platforms. Retail companies should leverage these AI solutions to achieve localization in a cost-effective and optimized manner to set the stage for a bright post-pandemic future. Get in touch with our experts to deliver personalized experiences to your customers and improve brand loyalty.


