Spreadsheet QnA with LLMs: Finding the Optimal Representation Format and the Strategy – Part-1

Introduction & Problem Statement
Spreadsheets remain the backbone of business data analysis, with Excel being one of the most widely used tools for organizing, calculating, and visualizing data. Despite their ubiquity, extracting insights from spreadsheets often requires manual analysis or specialized coding skills. Spreadsheet QnA (Question and Answering) aims to bridge this gap by enabling users to query spreadsheet data using natural language, similar to asking a colleague.
The core challenge is straightforward yet complex: how can we enable large language models (LLMs) to accurately understand, interpret, and answer questions about semi-structured spreadsheet data? This involves multiple sub-challenges:
- Representing tabular data in a format LLMs can effectively process
- Enabling accurate detection of table boundaries within larger documents
- Developing prompting strategies that facilitate precise reasoning over the data
- Handling the ambiguities inherent in spreadsheet layouts without explicit schema definitions
As spreadsheets often contain multiple tables interspersed with metadata, notes, or unrelated content, even sophisticated LLMs struggle to reliably extract and reason over this data without specialized approaches.
Why Do Standard LLMs Struggle With Spreadsheet Data?
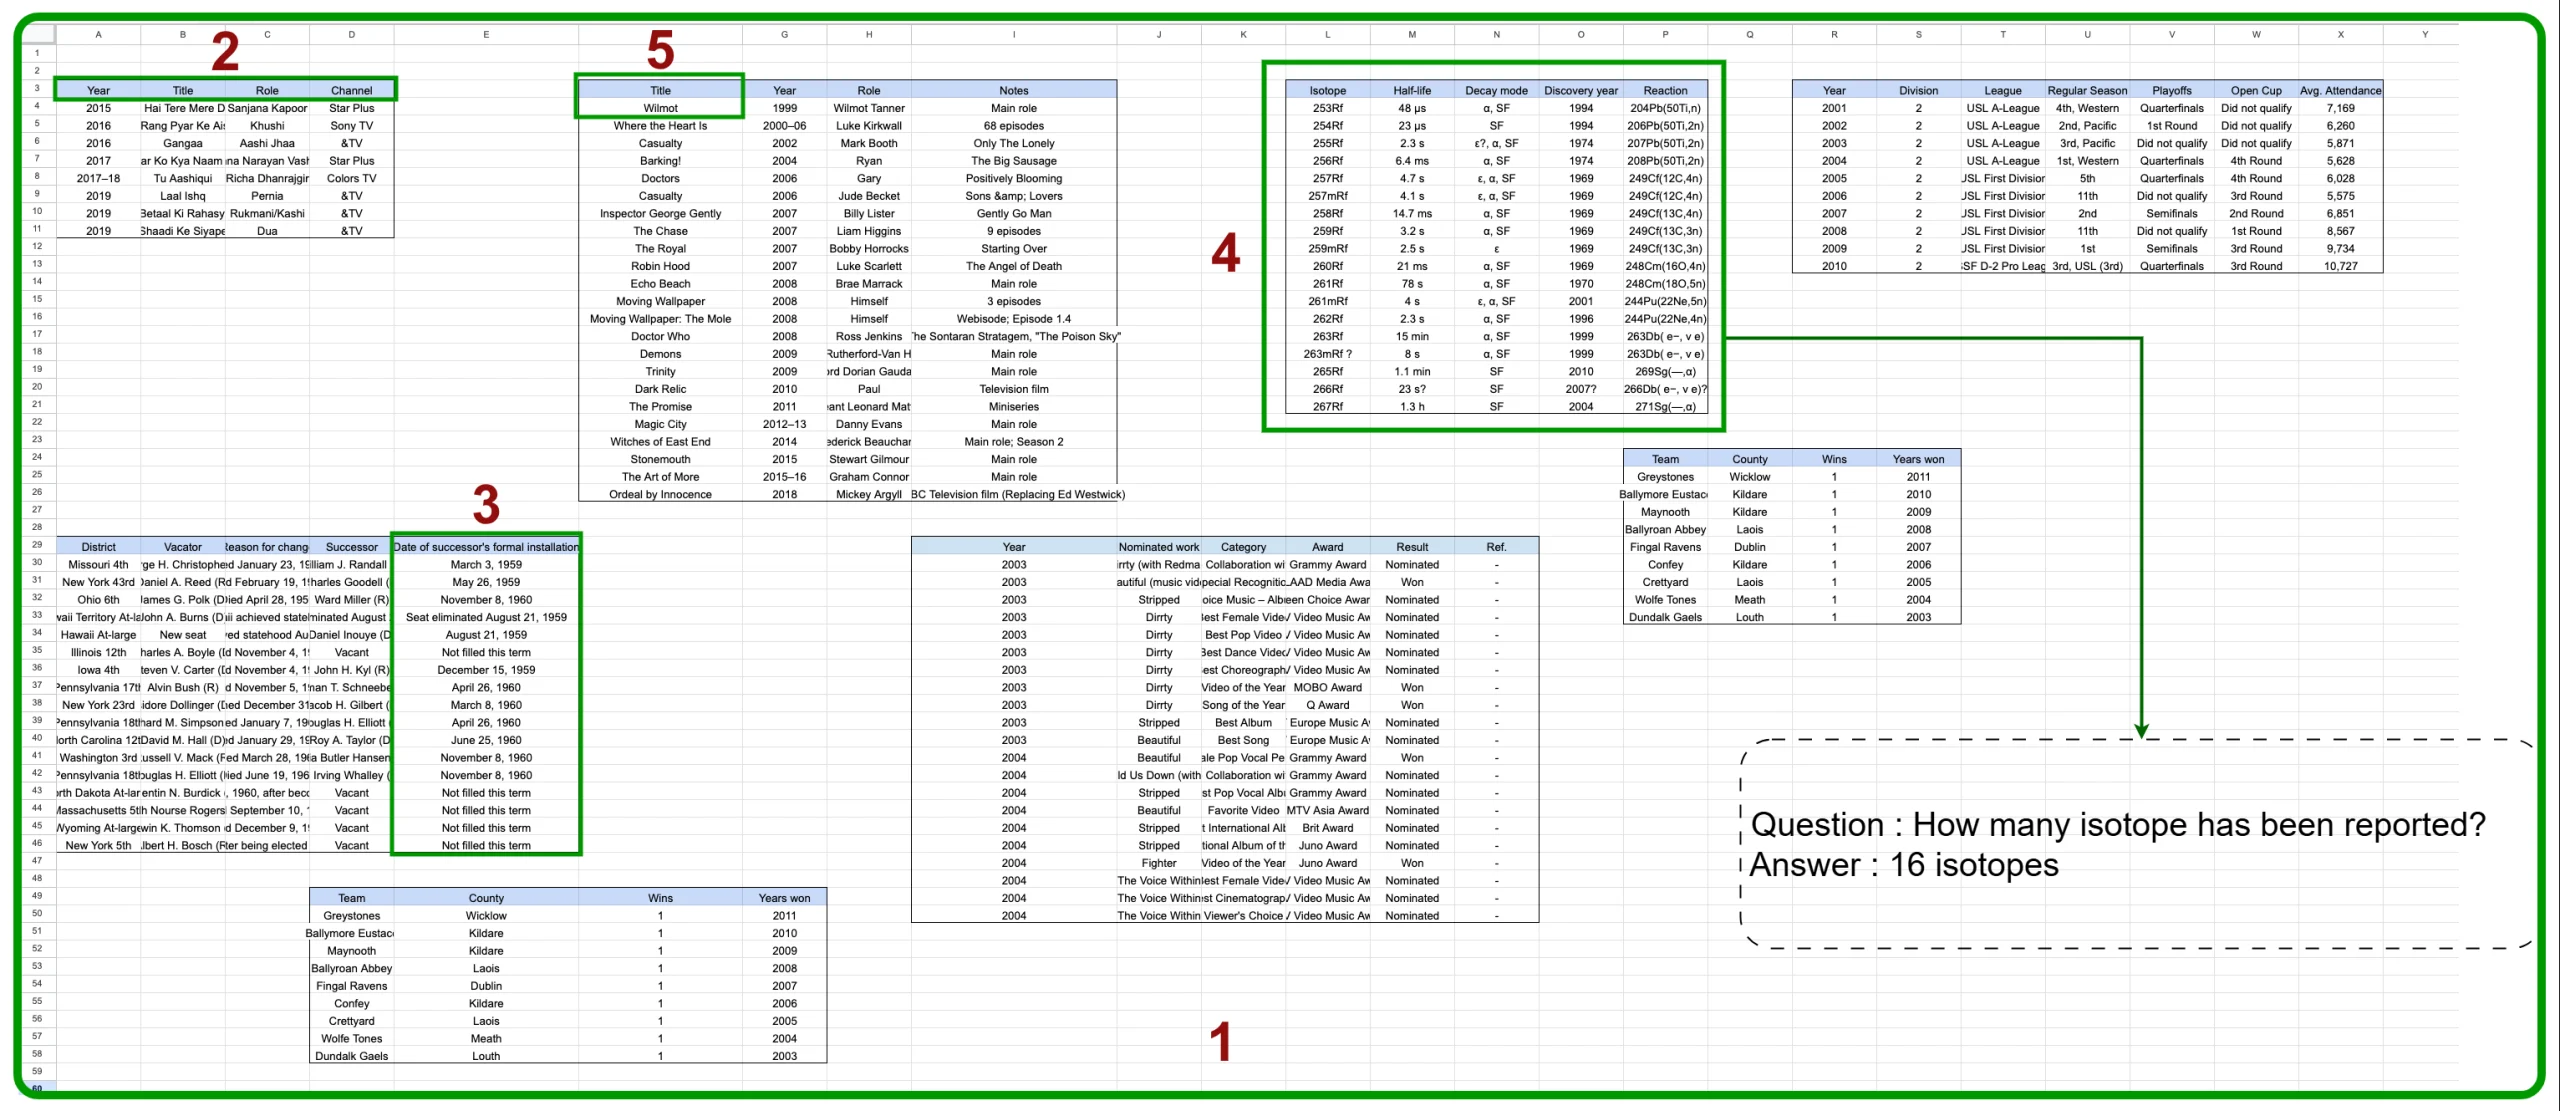
Out-of-the-box LLMs face several significant limitations when processing raw spreadsheets (refer the highlighted section in the above sheet to view the below mentioned limitations):
- Token Limits
We can see in the above sheet that it is made of multiple tables having many cells, other spreadsheets can have thousands of cells, far exceeding LLM context windows. - Structural Ambiguity
Spreadsheets are semi-structured; relationships (headers, groupings, etc.) as we can see in the above sheet. These aren’t preserved in text form when fed into an LLM. - Mixed Content Types
As we can see in the above mentioned sheet, the highlighted section contains a column with Date datatype, similarly a spreadsheet can have raw data, formulas, charts, and formatting all co-exist and are meaningful but get lost in naive extraction. - Boundary Detection
In the above example we have multiple tables separated with clear markers. Without this LLMs can’t reliably distinguish where one table ends and another begins. - Visual Context
Cues like color, bolding, and borders help humans interpret sheets but are invisible to LLMs.
What Representation Format Works Best for LLMs?
To address these challenges, we need to convert spreadsheets into formats that preserve their structural information while being processable by LLMs. We explored several representation formats.
We have mentioned the different representation strategies in this blog as well: State-of-the-Art LLMs Detect Table Spans in Spreadsheets? Exploring the Impact of Sheet Representation Strategies.
The idea to represent a spreadsheet in different representations comes from SpreadsheetLLM.
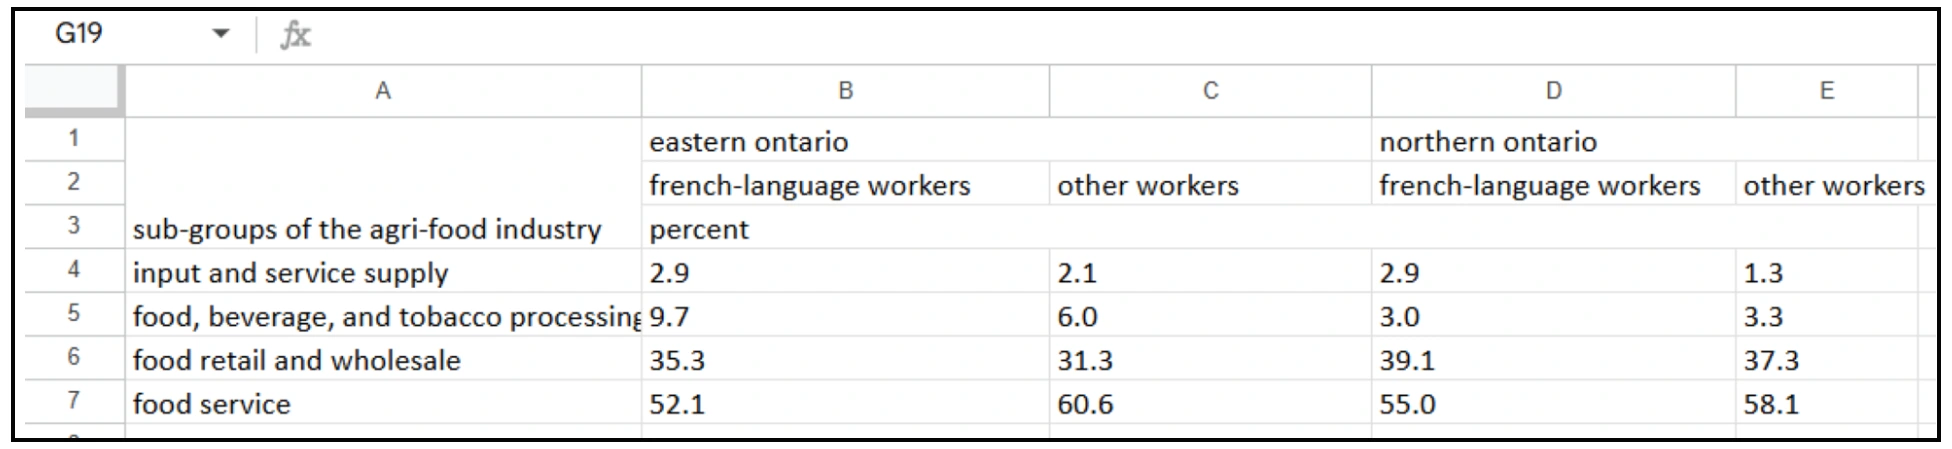
Input Spreadsheet
HTML Representation
HTML provides a structured way to represent tabular data while preserving cell relationships. We tested four variations:
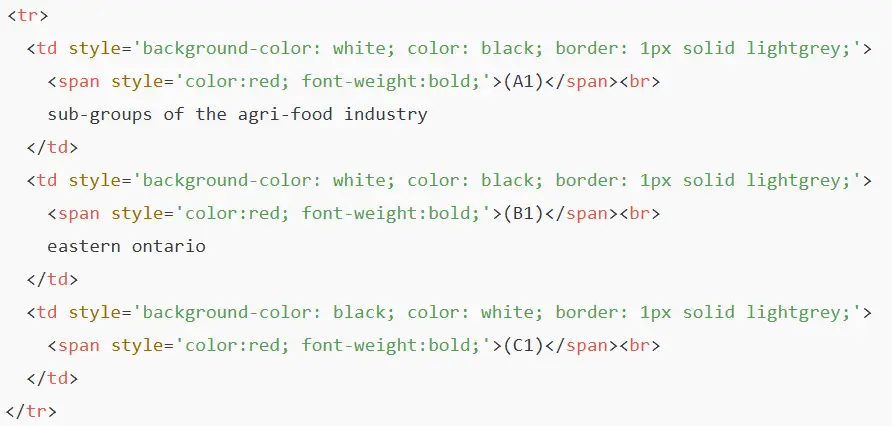
- HTML CODE WITH COLOR CODE AND WITH CELL ID:
We converted the spreadsheet into an HTML format, where:
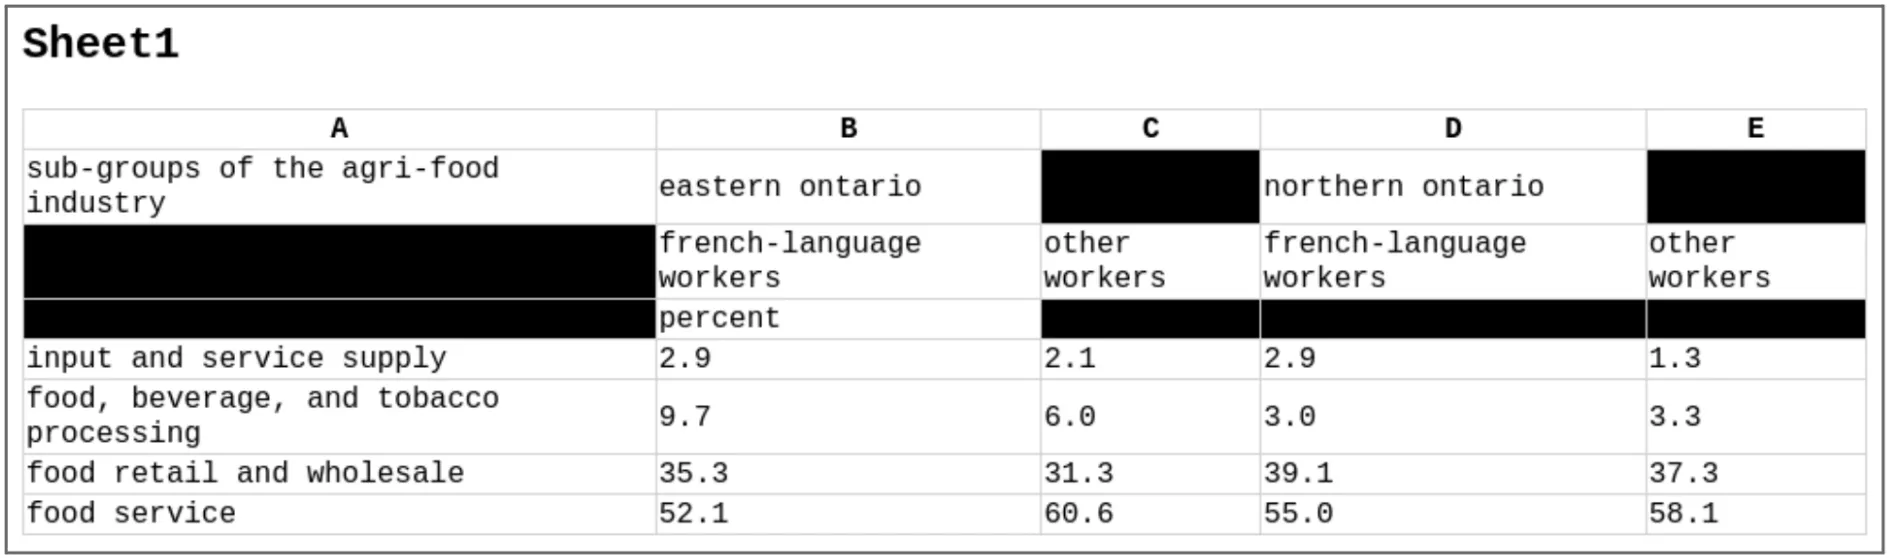
- White cells represent non-empty cells containing data.
- Black cells represent empty cells.
This approach uses color coding to provide visual cues for table boundaries.
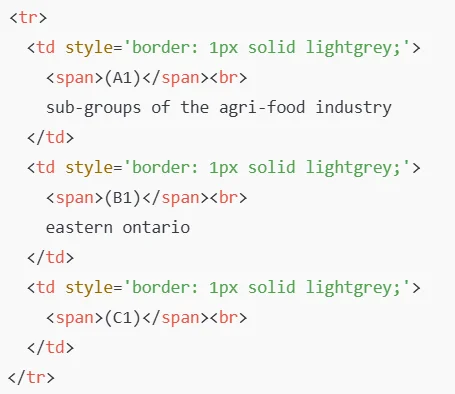
- HTML CODE WITHOUT COLOR CODE AND WITH CELL ID:
In this variation, we retained the HTML structure but removed color information, representing cells based purely on their content and structure and the cell id which is associated with each cell.
-
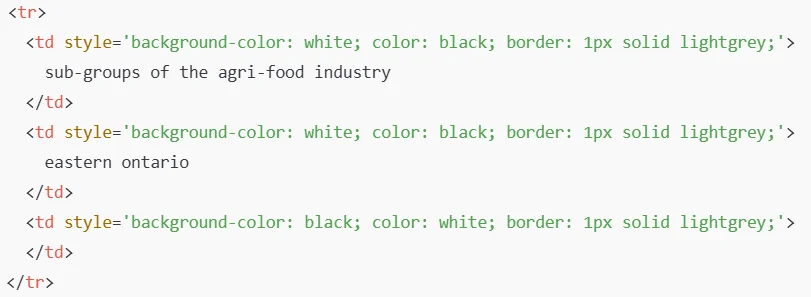
HTML CODE WITH COLOR CODE AND WITHOUT CELL ID:
In this variation, we retained the HTML structure with color information but removed the cell id which is associated with each cell.
-
HTML CODE WITHOUT COLOR CODE AND WITHOUT CELL ID:
In this variation, we retained the HTML structure but removed the color information and also removed the cell id which is associated with each cell.

Table Image
-
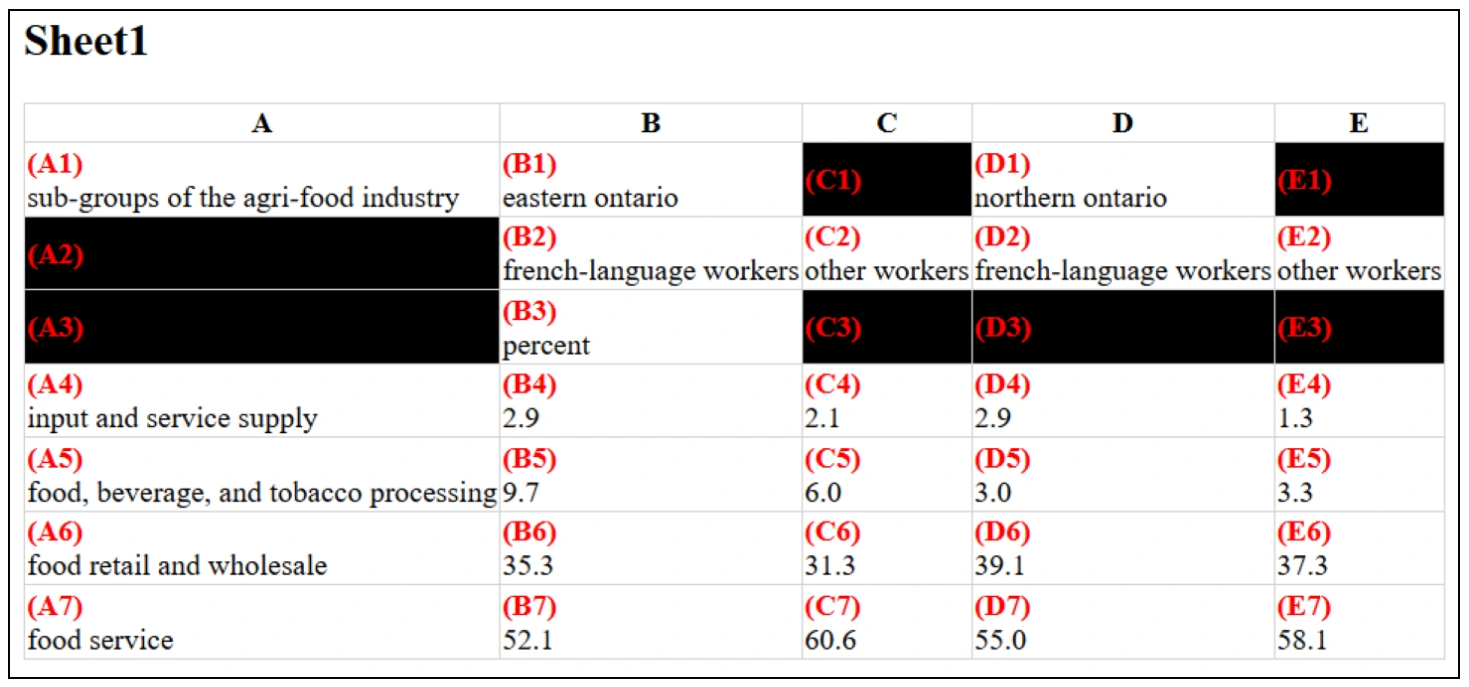
HTML TABLE IMAGE WITH COLOR CODE AND WITH CELL ID:
-
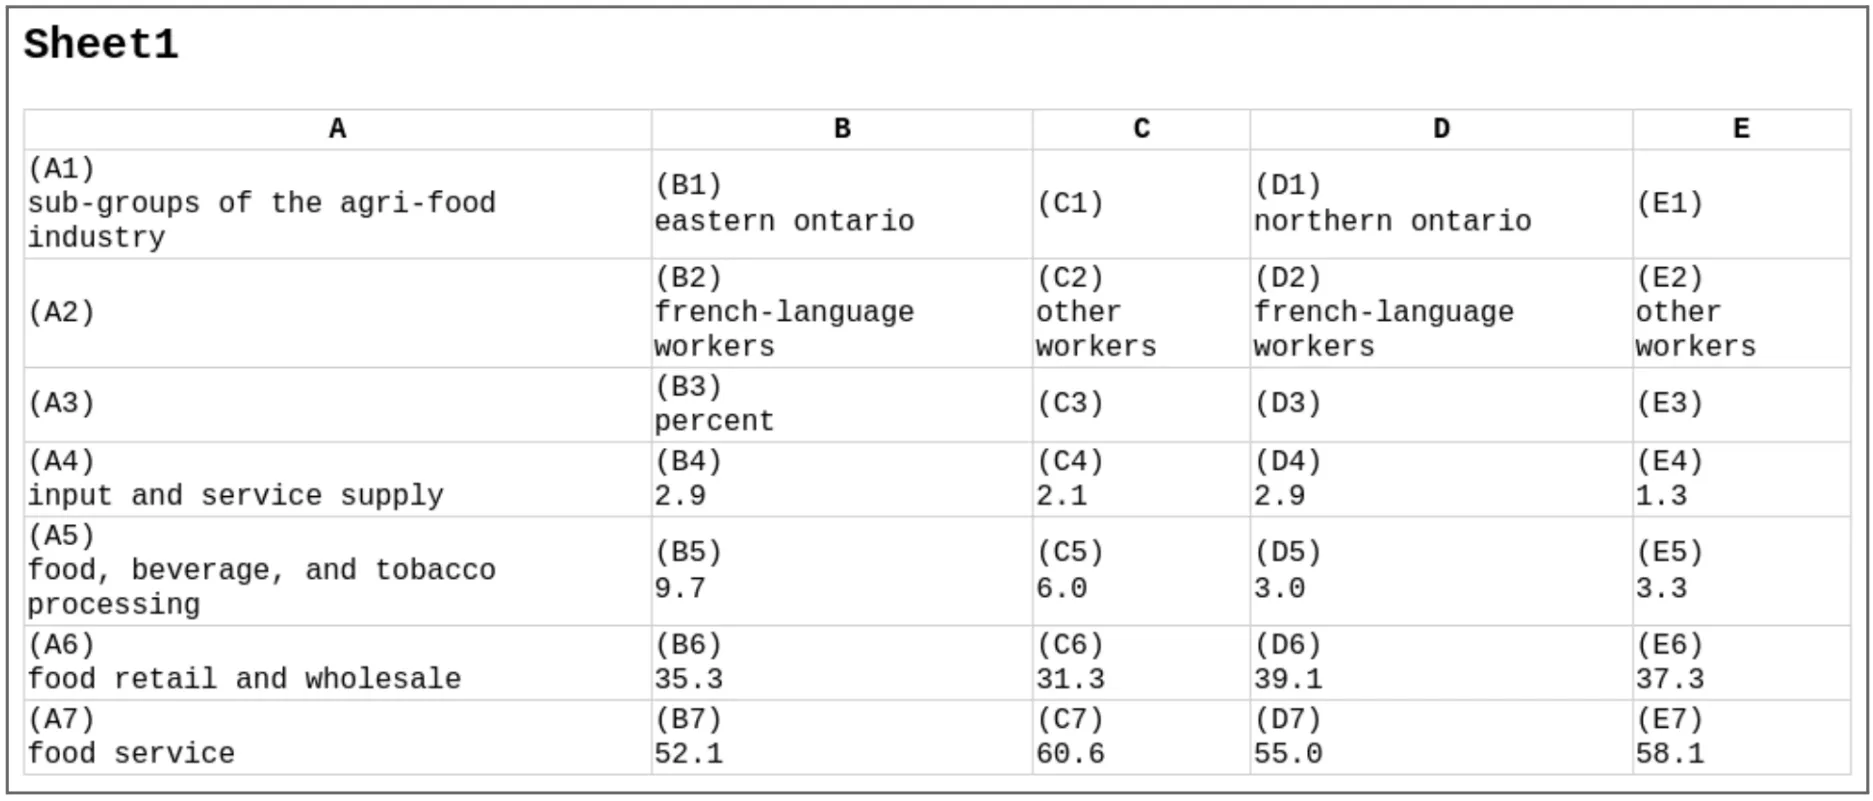
HTML TABLE IMAGE WITHOUT COLOR CODE AND WITH CELL ID:
-
HTML TABLE IMAGE WITH COLOR CODE AND WITHOUT CELL ID:
-
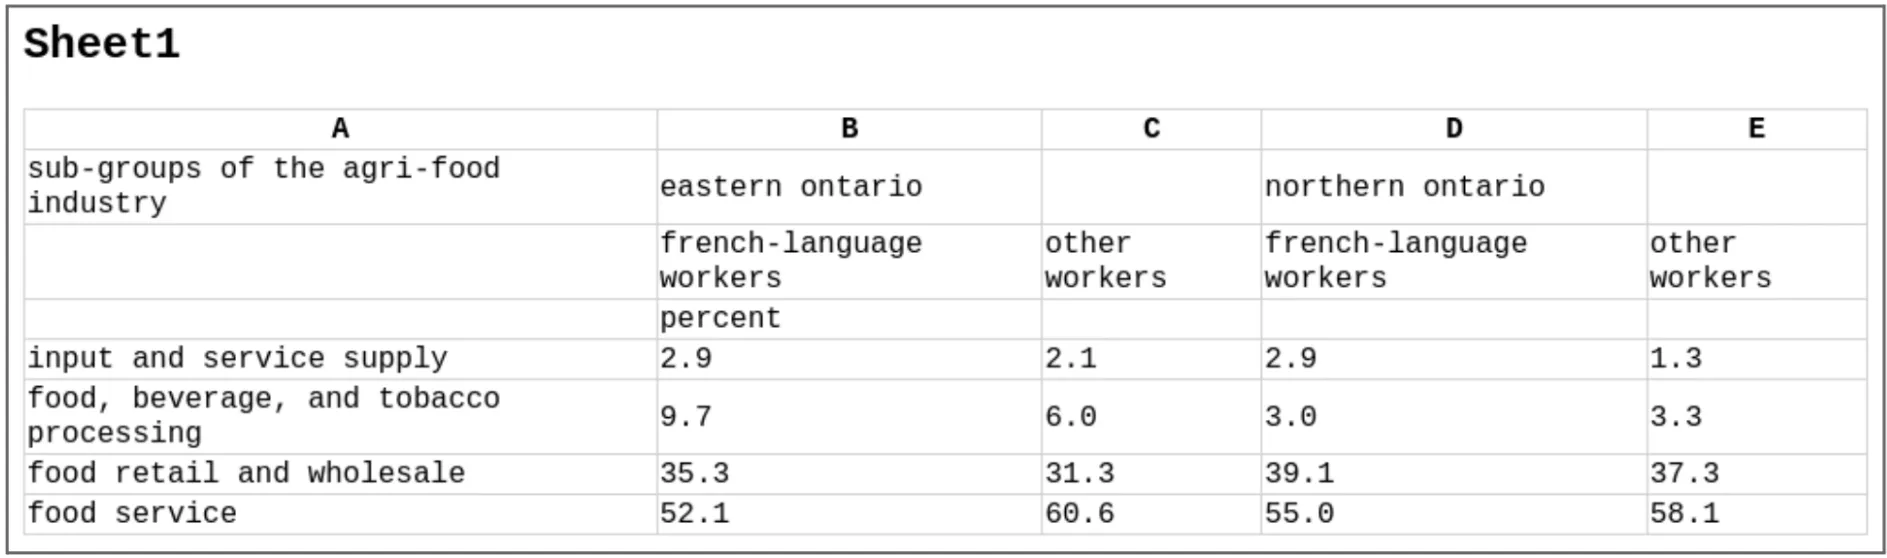
HTML TABLE IMAGE WITHOUT COLOR CODE AND WITHOUT CELL ID:
Markdown Representation
Markdown offers a lighter-weight text representation that’s still structured:
XLSX → Markdown:

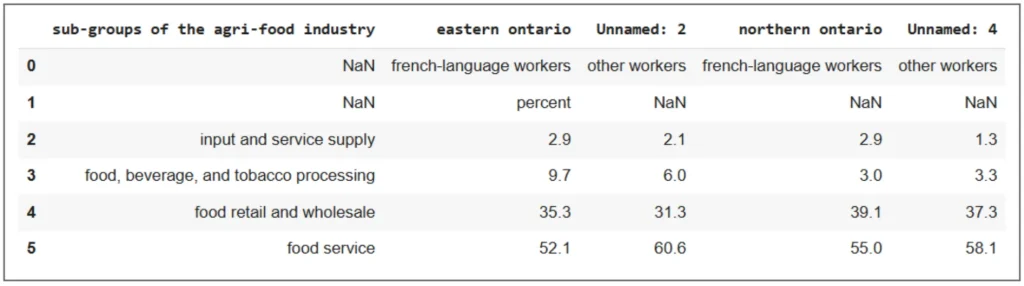
DataFrame
XLSX → DataFrame:
Which Representation Yields the Best Results?
Dataset Used
The HiTab dataset is a benchmark designed for question answering (QA) and natural language generation (NLG) tasks involving hierarchical tables. Unlike flat tables, hierarchical tables feature multi-level headers and nested groupings, presenting unique challenges for automated reasoning systems.
We have used 100 examples as our sample set to perform the benchmarking and accumulated the final results.
Prompting Strategy
A reasoning based approach was used which is a structured prompt in a single interaction that guides the LLM through a step-by-step reasoning process, allowing it to “think” through the problem before providing an answer.
Example Query & Response
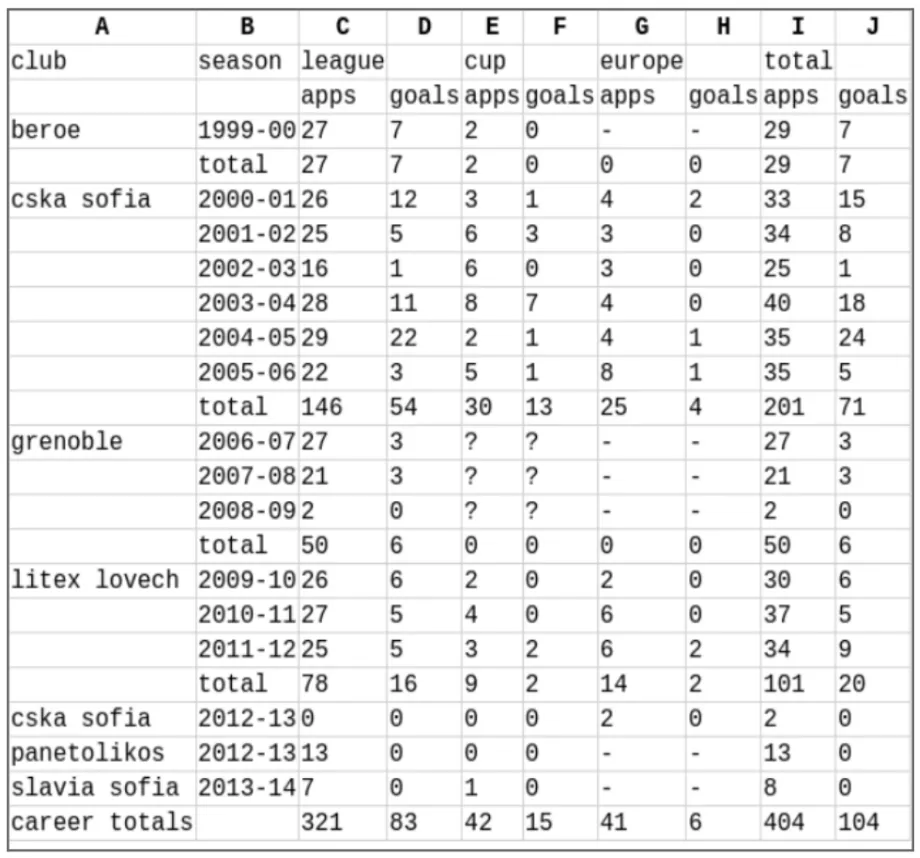
Question:
How many league goals did hristo yanev score for cska sofia?
Response:
“`json
{
“reasoning”: “To find out how many league goals Hristo Yanev scored for CSKA Sofia, I analyzed the provided HTML table. I looked for the row corresponding to ‘cska sofia’ and checked the columns under ‘goals’ for the league. The relevant data is found in the rows for the seasons 2000-01 to 2012-13. The league goals scored by CSKA Sofia in each season are as follows: 12 (2000-01), 5 (2001-02), 1 (2002-03), 11 (2003-04), 22 (2004-05), 3 (2005-06), 0 (2012-13). Summing these values gives a total of 54 league goals. Therefore, the total number of league goals scored by Hristo Yanev for CSKA Sofia is 54.”,
“answer”: “54”
}“`
Models Used
We tested our approaches across multiple state-of-the-art LLMs:
Metrics Used
We evaluated each representation format using a comprehensive set of metrics:
- Exact Match Accuracy (EM): The percentage of questions where the model’s answer exactly matches the ground truth
- ANLS (Answer Normalized Levenshtein Similarity): A more forgiving metric that measures how close the model’s answer is to the ground truth
Benchmarking Results
| Representation | GPT 4o | Claude 3.5 Sonnet | Gemini 2.0 Flash | |||
| EM | ANLS | EM | ANLS | EM | ANLS | |
| HTML CODE WITHOUT COLOR AND WITHOUT CELL ID | 75 | 83 | 82 | 90.1 | 70 | 76.3 |
| HTML CODE WITH COLOR AND WITH CELL ID | 67 | 77.5 | 75 | 83.11 | 61 | 70 |
| HTML CODE WITHOUT COLOR AND WITH CELL ID | 77 | 83.2 | 82 | 87.5 | 68 | 76.3 |
| HTML CODE WITH COLOR AND WITHOUT CELL ID | 73 | 81.59 | 80 | 86.5 | 68 | 75.3 |
| MARKDOWN CODE WITHOUT CELL ID | 60 | 74.16 | 76 | 86 | 49 | 64.74 |
| MARKDOWN CODE WITH CELL ID | 71 | 79.44 | 81 | 87.5 | 67 | 75.97 |
| XLSX TO MARKDOWN CODE WITHOUT CELL ID | 70 | 78.65 | 83 | 88.94 | 67 | 74.78 |
| DATAFRAME | 73 | 81.63 | 86 | 91.23 | 67 | 74.12 |
| IMAGE WITHOUT COLOR AND WITHOUT CELL ID | 74 | 84.74 | 83 | 88.94 | 69 | 77.38 |
| IMAGE WITH COLOR AND WITH CELL ID | 65 | 77.5 | 42 | 47.42 | 57 | 67.92 |
| IMAGE WITHOUT COLOR AND WITH CELL ID | 66 | 80.17 | 39 | 44.7 | 59 | 70.23 |
| IMAGE WITH COLOR AND WITHOUT CELL ID | 69 | 82 | 64 | 74.8 | 59 | 68.22 |
Key Findings & Analysis
- HTML-based representations are superior: HTML consistently outperformed other formats across all models and metrics, particularly HTML without color and with cell IDs.
- Color encoding hurts more than helps: Surprisingly, adding color encoding to highlight empty versus non-empty cells actually decreased performance in most cases. This may be due to the additional tokens required or because it distracts from the structural information.
- Cell IDs are valuable in most cases: Including cell IDs (e.g., A1, B22) improved performance for most formats by providing explicit spatial context that helps the LLM understand the table structure.
- Token efficiency matters: Image & Markdown representations achieved comparable performance to HTML in some cases while using only about 1/3rd of the tokens, making them cost-effective alternatives when API expenses are a concern.
- Model capabilities vary: Reasoning models like GPT-O1, GPT-4O, and Claude Sonnet 3.5 performed marginally better than other models across most representations.
Current Limitations & Future Research Directions
While our research has identified effective approaches for Spreadsheet QnA, several challenges remain:
Current Limitations
- Achieving Higher Accuracy: While our best approaches achieve good results, there’s still room for improvement, particularly with complex queries.
- Multi-table and multi-sheet detection: Our current focus has been largely on single-table datasets. Handling multiple tables and sheets with cross-references remains challenging.
- Cost efficiency: The token consumption for processing large spreadsheets can be substantial, particularly for HTML representations of complex tables.
- Visual elements: Sheets containing charts, graphs, and other visual elements are not considered in our benchmarking.
Future Research Directions
Our roadmap includes:
- Parsing multiple tables and sheets: Extending our approach to handle spreadsheets with multiple tables, sheets, and cross-sheet references.
- Enterprise-level validation: Expanding our testing to more complex, real-world enterprise spreadsheets to validate the approach in practical scenarios.
- Exploring alternative approaches: Investigating LLM based Planning & Code Execution based workflows alongside our current reasoning-based approach to potentially enhance performance for complex queries.
- Cost reduction strategies: Exploring methods to reduce token consumption without sacrificing accuracy, such as selective extraction or compression techniques.
Conclusion
Our research demonstrates that with proper representation formats and reasoning-based prompting strategies, state-of-the-art LLMs can effectively answer questions about spreadsheet data with high accuracy. HTML representations (particularly without color and with cell IDs), combined with structured reasoning prompts, offer strong performance across multiple LLMs.
The findings provide clear guidance for developers looking to implement Spreadsheet QnA systems:
- Convert spreadsheets to HTML format, preferably without color encoding but with cell IDs
- Use reasoning-based prompting to encourage step-by-step analysis
- Be cautious with multi-table spreadsheets, where accuracy remains a challenge
By continuing to refine these approaches and addressing the limitations outlined above, we aim to make spreadsheet data as accessible and queryable as any other data source, ultimately enabling more natural and intuitive interactions with one of the most ubiquitous data formats in business.